## Horizontal Bar Chart: Activation Function Performance
### Overview
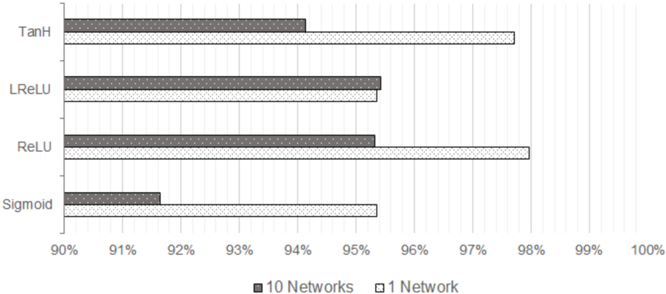
The image is a horizontal bar chart comparing the performance of different activation functions (TanH, LReLU, ReLU, Sigmoid) in neural networks. Performance is measured as a percentage, likely accuracy or a similar metric. The chart compares the performance of each activation function when used in a single network versus an ensemble of 10 networks.
### Components/Axes
* **Y-axis (Vertical):** Categorical axis listing the activation functions: TanH, LReLU, ReLU, Sigmoid.
* **X-axis (Horizontal):** Numerical axis representing performance percentage, ranging from 90% to 100% with tick marks at each percentage point.
* **Legend:** Located at the bottom of the chart.
* Dark Gray: "10 Networks"
* White with gray dots: "1 Network"
### Detailed Analysis
The chart displays the performance of each activation function for both a single network and an ensemble of 10 networks.
* **TanH:**
* 10 Networks (Dark Gray): Approximately 94%.
* 1 Network (White with gray dots): Approximately 97.8%.
* **LReLU:**
* 10 Networks (Dark Gray): Approximately 95.8%.
* 1 Network (White with gray dots): Approximately 95.2%.
* **ReLU:**
* 10 Networks (Dark Gray): Approximately 95.2%.
* 1 Network (White with gray dots): Approximately 97.6%.
* **Sigmoid:**
* 10 Networks (Dark Gray): Approximately 91.6%.
* 1 Network (White with gray dots): Approximately 93.0%.
### Key Observations
* For all activation functions, the performance is above 90%.
* Sigmoid has the lowest performance compared to the other activation functions.
* For TanH and ReLU, the performance of a single network is significantly higher than that of 10 networks.
* For LReLU, the performance of 10 networks is slightly higher than that of a single network.
* The performance difference between 1 network and 10 networks is minimal for LReLU.
### Interpretation
The chart suggests that the choice of activation function can significantly impact the performance of a neural network. The performance of TanH and ReLU is better in a single network, while LReLU performs slightly better in an ensemble of 10 networks. Sigmoid consistently shows the lowest performance, indicating it may not be the optimal choice for this particular task or network architecture. The fact that ensembling (10 networks) doesn't always improve performance suggests that the single network configurations for TanH and ReLU are already well-optimized, or that ensembling introduces other complexities that negate the benefits. The data implies that the optimal activation function and network configuration are highly dependent on the specific problem and architecture.