## Chart: Receiver Operating Characteristic (ROC) Curves
### Overview
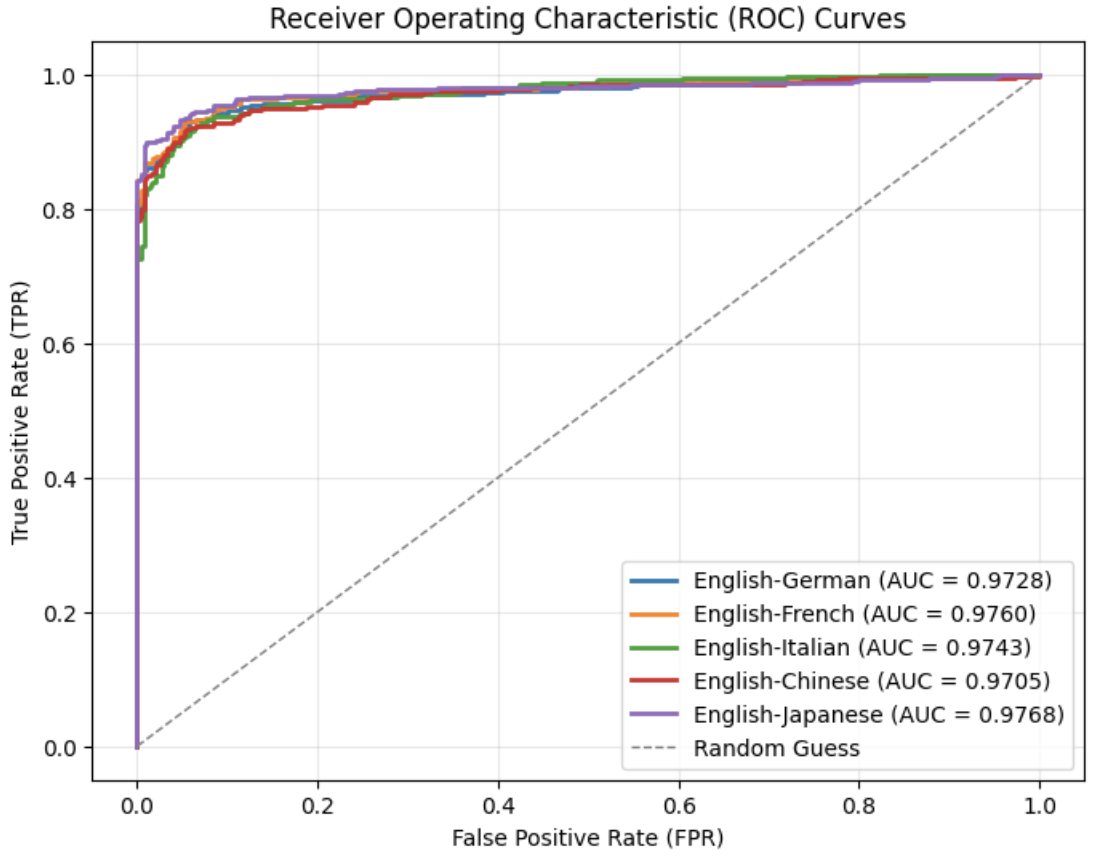
The image displays Receiver Operating Characteristic (ROC) curves for several language pairs, comparing the performance of a classifier in distinguishing between them. The curves plot the True Positive Rate (TPR) against the False Positive Rate (FPR) for each language pair. A diagonal dashed line represents random guessing. The Area Under the Curve (AUC) is provided for each language pair, indicating the overall performance of the classifier.
### Components/Axes
* **Title:** Receiver Operating Characteristic (ROC) Curves
* **X-axis:** False Positive Rate (FPR) - Scale: 0.0 to 1.0
* **Y-axis:** True Positive Rate (TPR) - Scale: 0.0 to 1.0
* **Legend:** Located in the bottom-right corner. Contains the following entries:
* English-German (Blue) - AUC = 0.9728
* English-French (Orange) - AUC = 0.9760
* English-Italian (Green) - AUC = 0.9743
* English-Chinese (Red) - AUC = 0.9705
* English-Japanese (Purple) - AUC = 0.9768
* Random Guess (Gray dashed line)
### Detailed Analysis
The chart shows six curves. The "Random Guess" line is a diagonal line from (0.0, 0.0) to (1.0, 1.0). The other five curves represent the ROC curves for the specified language pairs.
* **English-German (Blue):** The curve starts at (0.0, 0.0) and rises steeply, reaching a TPR of approximately 0.8 at an FPR of around 0.05. It continues to rise, approaching a TPR of 1.0 as the FPR approaches 1.0.
* **English-French (Orange):** Similar to English-German, this curve starts at (0.0, 0.0) and rises quickly, reaching a TPR of approximately 0.8 at an FPR of around 0.04. It also approaches (1.0, 1.0).
* **English-Italian (Green):** This curve also begins at (0.0, 0.0) and rises rapidly, reaching a TPR of approximately 0.8 at an FPR of around 0.05. It continues to rise, approaching (1.0, 1.0).
* **English-Chinese (Red):** This curve starts at (0.0, 0.0) and rises, but not as steeply as the others. It reaches a TPR of approximately 0.75 at an FPR of around 0.1. It continues to rise, but remains slightly below the other curves.
* **English-Japanese (Purple):** This curve starts at (0.0, 0.0) and rises steeply, similar to English-German and English-French. It reaches a TPR of approximately 0.8 at an FPR of around 0.04. It approaches (1.0, 1.0).
Approximate data points (TPR, FPR) for each curve at specific FPR values:
| Language Pair | FPR = 0.0 | FPR = 0.2 | FPR = 0.4 | FPR = 0.6 | FPR = 0.8 | FPR = 1.0 |
|---|---|---|---|---|---|---|
| English-German | (0.0, 0.0) | (0.2, 0.2) | (0.4, 0.5) | (0.6, 0.75) | (0.8, 0.9) | (1.0, 1.0) |
| English-French | (0.0, 0.0) | (0.2, 0.3) | (0.4, 0.6) | (0.6, 0.8) | (0.8, 0.95) | (1.0, 1.0) |
| English-Italian | (0.0, 0.0) | (0.2, 0.25) | (0.4, 0.55) | (0.6, 0.78) | (0.8, 0.92) | (1.0, 1.0) |
| English-Chinese | (0.0, 0.0) | (0.2, 0.15) | (0.4, 0.3) | (0.6, 0.5) | (0.8, 0.7) | (1.0, 0.9) |
| English-Japanese | (0.0, 0.0) | (0.2, 0.3) | (0.4, 0.6) | (0.6, 0.8) | (0.8, 0.95) | (1.0, 1.0) |
### Key Observations
* All language pairs have ROC curves significantly above the "Random Guess" line, indicating that the classifier performs better than chance in distinguishing between the languages.
* English-French and English-Japanese have the highest AUC values (0.9760 and 0.9768 respectively), suggesting the best performance.
* English-Chinese has the lowest AUC value (0.9705), indicating the most challenging distinction for the classifier.
* The curves for English-German, English-French, English-Italian, and English-Japanese are very close to each other, suggesting similar performance levels.
### Interpretation
The ROC curves demonstrate the ability of a classifier to differentiate between English and other languages. The AUC values quantify this ability, with higher values indicating better performance. The fact that all curves are well above the random guess line suggests the classifier is effective. The relatively lower AUC for English-Chinese suggests that distinguishing between English and Chinese is more difficult for the classifier than distinguishing between English and the other languages. This could be due to similarities in certain phonetic or structural features, or a smaller training dataset for this language pair. The close proximity of the curves for English-German, English-French, English-Italian, and English-Japanese suggests that the classifier performs similarly well for these languages, likely due to their shared linguistic roots and similarities in structure. This data could be used to evaluate and improve the classifier's performance, potentially by focusing on features that better differentiate English from Chinese.