\n
## Chart: Skin Friction Coefficient vs. Normalized Distance
### Overview
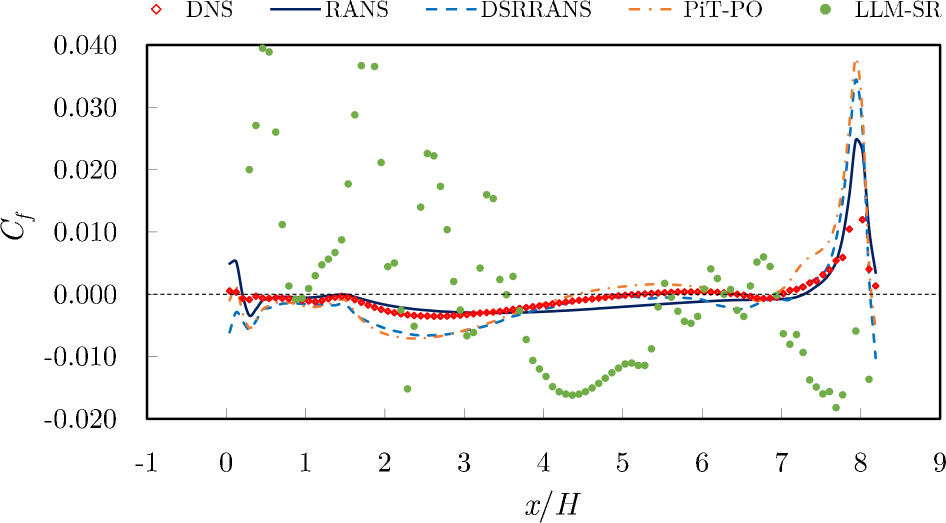
The image presents a line chart comparing the skin friction coefficient (Cf) against the normalized distance (x/H) for several turbulence models. The chart displays data from Direct Numerical Simulation (DNS), Reynolds-Averaged Navier-Stokes (RANS), Delayed Detached Eddy Simulation (DSRRANS), Pit-PO, and Large Eddy Simulation (LLM-SR). The DNS data is represented as scattered points, while the other models are shown as lines.
### Components/Axes
* **X-axis:** x/H (Normalized Distance). Scale ranges from approximately -1 to 9.
* **Y-axis:** Cf (Skin Friction Coefficient). Scale ranges from approximately -0.020 to 0.040.
* **Legend:** Located at the top of the chart, identifying each data series with a specific color and line style.
* DNS (Red Diamonds)
* RANS (Solid Black Line)
* DSRRANS (Blue Dashed Line)
* PiT-PO (Orange Dotted Line)
* LLM-SR (Green Circles)
### Detailed Analysis
* **DNS (Red Diamonds):** The DNS data shows significant scatter, with Cf values ranging from approximately -0.015 to 0.035. There's a general trend of increasing Cf as x/H approaches 9, with a peak around x/H = 8.5.
* **RANS (Solid Black Line):** The RANS line starts at approximately 0.002 at x/H = -1, dips to around -0.005 at x/H = 0, remains relatively flat around -0.002 to 0.001 from x/H = 1 to 7, and then rises sharply to approximately 0.015 at x/H = 9.
* **DSRRANS (Blue Dashed Line):** The DSRRANS line begins at approximately 0.005 at x/H = -1, dips to around -0.010 at x/H = 0, fluctuates between -0.010 and 0.005 from x/H = 1 to 7, and then increases rapidly to approximately 0.035 at x/H = 9.
* **PiT-PO (Orange Dotted Line):** The PiT-PO line starts at approximately 0.001 at x/H = -1, remains relatively flat around 0.000 to 0.002 from x/H = 0 to 7, and then increases to approximately 0.010 at x/H = 9.
* **LLM-SR (Green Circles):** The LLM-SR data shows significant scatter, with Cf values ranging from approximately -0.020 to 0.030. There's a general trend of increasing Cf as x/H approaches 9, with a peak around x/H = 8.
### Key Observations
* The DNS data exhibits the highest degree of variability, indicating the complex nature of the turbulent flow.
* RANS provides the smoothest and most conservative estimate of Cf, consistently underpredicting the values observed in DNS.
* DSRRANS shows a more dynamic behavior than RANS, capturing some of the fluctuations seen in DNS, but still smoothing out much of the detail.
* PiT-PO provides a relatively stable prediction of Cf, similar to RANS but with slightly higher values.
* LLM-SR shows a similar trend to DNS, but with less scatter.
* All models show a significant increase in Cf as x/H approaches 9, suggesting a region of increased shear stress.
### Interpretation
The chart compares the performance of different turbulence models in predicting the skin friction coefficient along a surface. The DNS data serves as a benchmark, representing the most accurate (but computationally expensive) solution. The other models offer varying levels of accuracy and computational cost.
The significant scatter in the DNS data highlights the inherent complexity of turbulent flows. The RANS model, being the simplest, provides a smoothed-out representation that may be suitable for engineering applications where accuracy is less critical. DSRRANS and PiT-PO offer improvements over RANS by capturing some of the turbulent fluctuations, while LLM-SR appears to provide a good balance between accuracy and computational cost.
The sharp increase in Cf near x/H = 9 suggests a region of flow separation or adverse pressure gradient, where the shear stress at the wall is significantly increased. The differences in how each model captures this phenomenon indicate their varying abilities to resolve complex flow features. The divergence between the models at higher x/H values suggests that the choice of turbulence model can significantly impact the prediction of skin friction drag in this region.