## Pie Charts: Reasoning Skills and Capabilities
### Overview
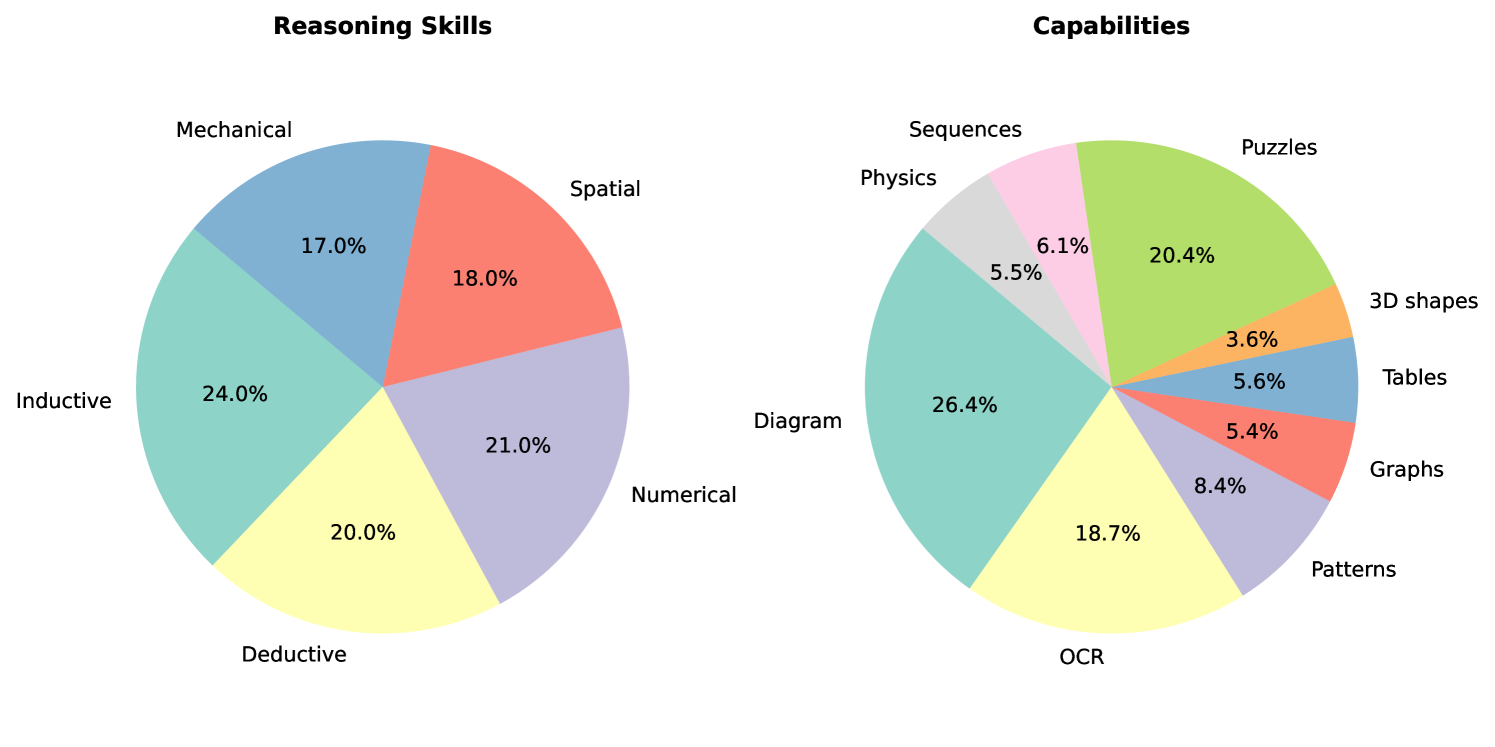
The image displays two distinct pie charts presented side-by-side on a white background. The left chart is titled "Reasoning Skills," and the right chart is titled "Capabilities." Each chart is divided into colored slices representing different categories, with percentage values labeled directly on or adjacent to each slice. There is no separate legend; category labels are placed outside the pie, pointing to their respective slices.
### Components/Axes
**Chart 1 (Left): "Reasoning Skills"**
* **Title:** "Reasoning Skills" (centered above the chart).
* **Categories & Labels (with approximate slice positions and colors):**
* **Mechanical:** 17.0% (Blue slice, top-left quadrant).
* **Spatial:** 18.0% (Red slice, top-right quadrant).
* **Numerical:** 21.0% (Light purple slice, bottom-right quadrant).
* **Deductive:** 20.0% (Yellow slice, bottom-left quadrant).
* **Inductive:** 24.0% (Teal/green slice, left side).
**Chart 2 (Right): "Capabilities"**
* **Title:** "Capabilities" (centered above the chart).
* **Categories & Labels (with approximate slice positions and colors):**
* **Diagram:** 26.4% (Teal/green slice, left side).
* **OCR:** 18.7% (Yellow slice, bottom).
* **Patterns:** 8.4% (Light purple slice, bottom-right).
* **Graphs:** 5.4% (Red slice, right side).
* **Tables:** 5.6% (Blue slice, right side).
* **3D shapes:** 3.6% (Orange slice, right side).
* **Puzzles:** 20.4% (Light green slice, top-right quadrant).
* **Sequences:** 6.1% (Pink slice, top).
* **Physics:** 5.5% (Gray slice, top-left quadrant).
### Detailed Analysis
**Reasoning Skills Chart:**
The distribution of reasoning skills is relatively balanced, with no single category holding a majority. The largest segment is **Inductive** reasoning at 24.0%. The smallest segment is **Mechanical** reasoning at 17.0%. The remaining three categories—**Numerical** (21.0%), **Deductive** (20.0%), and **Spatial** (18.0%)—are closely grouped within a 3-percentage-point range.
**Capabilities Chart:**
This chart shows a more varied distribution. The most prominent capability is **Diagram** interpretation at 26.4%. **Puzzles** (20.4%) and **OCR** (Optical Character Recognition) (18.7%) are also significant components. The remaining six categories are all below 10%, with **3D shapes** being the smallest at 3.6%. The capabilities span visual processing (Diagram, 3D shapes, Patterns), textual/data processing (OCR, Tables, Graphs), and logical/sequential tasks (Puzzles, Sequences, Physics).
### Key Observations
1. **Dominant Categories:** Each chart has one clearly dominant category: **Inductive** (24.0%) for Reasoning Skills and **Diagram** (26.4%) for Capabilities.
2. **Balance vs. Skew:** The Reasoning Skills chart shows a more even distribution among its five categories. The Capabilities chart is more skewed, with the top three categories (Diagram, Puzzles, OCR) accounting for approximately 65.5% of the total.
3. **Smallest Segments:** The smallest segments in each chart are **Mechanical** (17.0%) and **3D shapes** (3.6%), suggesting these are the least represented skills/capabilities in this dataset.
4. **Color Reuse:** Colors are reused between the two charts (e.g., teal for Inductive/Diagram, yellow for Deductive/OCR, red for Spatial/Graphs) but do not appear to carry consistent meaning across the two separate charts.
### Interpretation
These charts likely represent a profile or assessment of an entity's cognitive abilities, such as an AI system, a student, or a professional role. The data suggests a strong aptitude for **visual-spatial and inductive reasoning**. The high value for "Diagram" capability aligns with the strong "Inductive" and "Spatial" reasoning scores, indicating an ability to interpret visual information and infer patterns.
The relatively lower scores in "Mechanical" reasoning and "3D shapes" capability might indicate a comparative weakness in tasks involving physical systems or three-dimensional manipulation. The presence of "OCR," "Tables," and "Graphs" as distinct categories highlights an emphasis on data and document processing as key capabilities.
Overall, the profile depicts an entity strongest in visual, pattern-based, and puzzle-solving tasks, with a solid foundation in numerical and deductive reasoning, but with less emphasis on mechanical or purely three-dimensional spatial tasks. The two charts together provide a complementary view: the left chart outlines the *types* of reasoning, while the right chart details the specific *application domains* or task types where those reasoning skills are deployed.