## Mixed Diagram: Truth Table and Probability Distribution Chart
### Overview
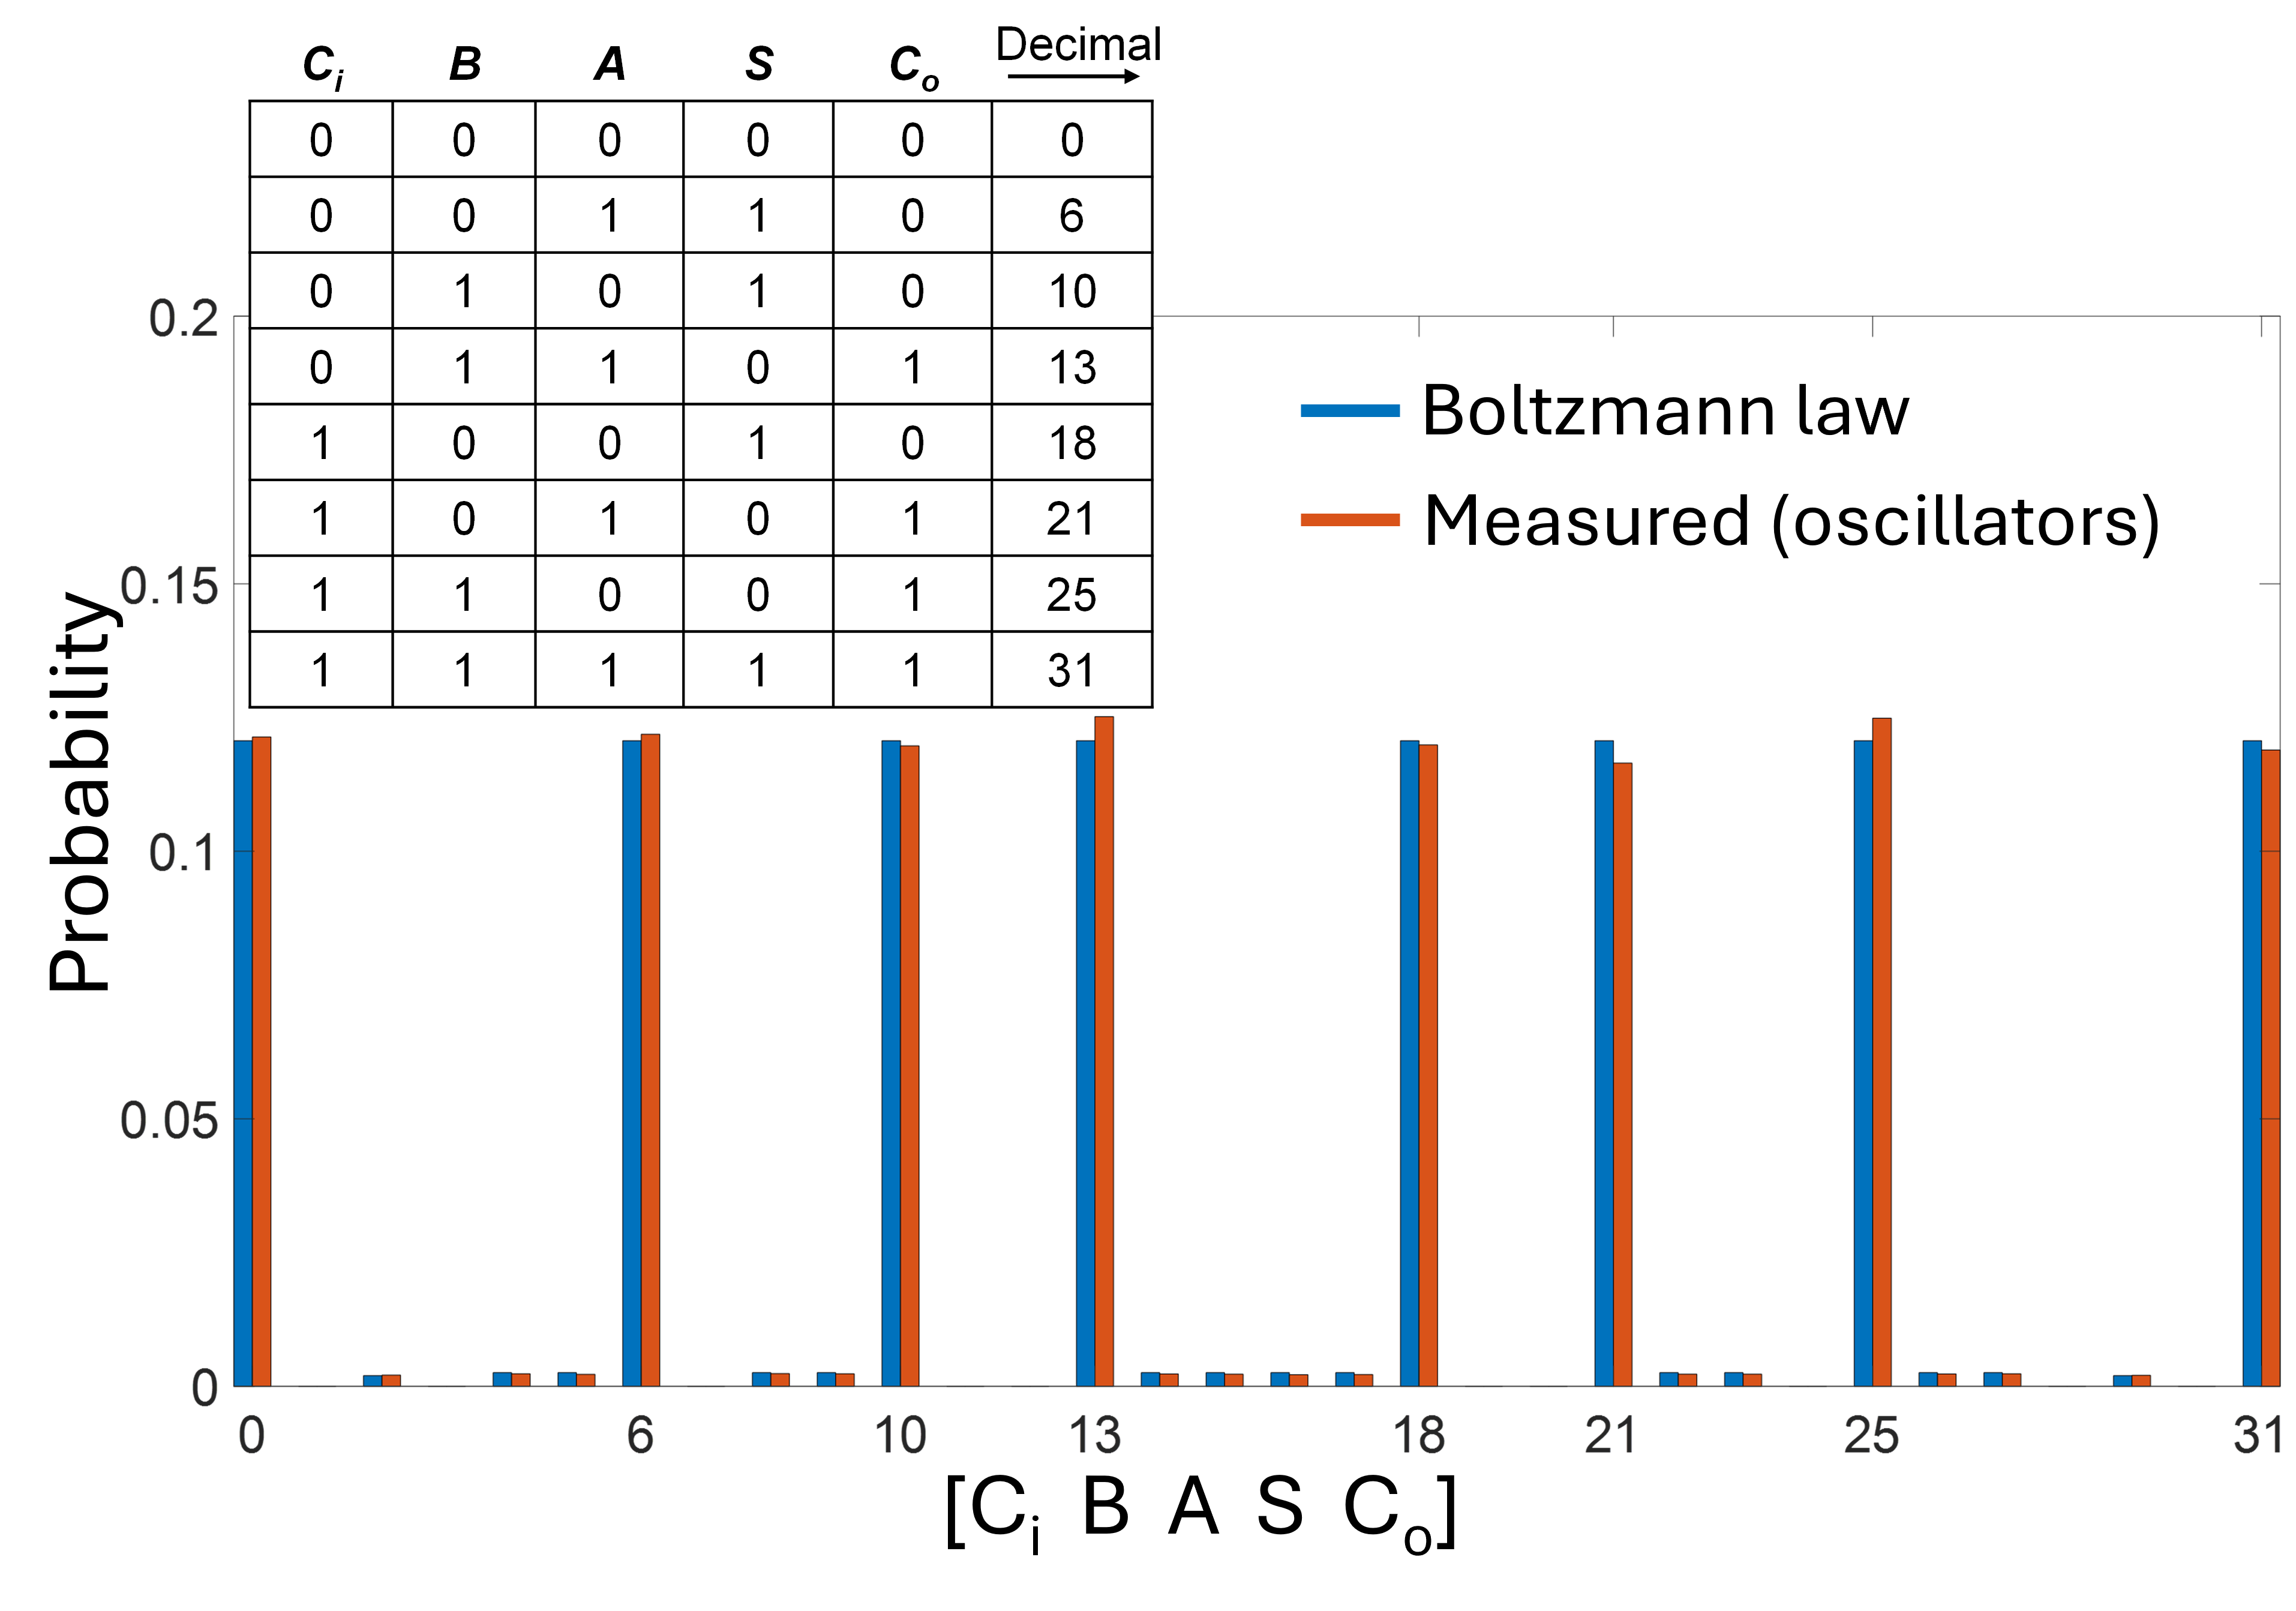
The image presents a combined data visualization consisting of a truth table (top-left) and a grouped bar chart (bottom). The chart compares theoretical probability values ("Boltzmann law") against experimental measurements ("Measured (oscillators)") for specific binary states. The truth table defines the binary inputs and outputs ($C_i, B, A, S, C_o$) and their corresponding decimal values, which serve as the X-axis coordinates for the bar chart.
### Components/Axes
**1. Truth Table (Top-Left)**
| $C_i$ | $B$ | $A$ | $S$ | $C_o$ | Decimal |
| :--- | :--- | :--- | :--- | :--- | :--- |
| 0 | 0 | 0 | 0 | 0 | 0 |
| 0 | 0 | 1 | 1 | 0 | 6 |
| 0 | 1 | 0 | 1 | 0 | 10 |
| 0 | 1 | 1 | 0 | 1 | 13 |
| 1 | 0 | 0 | 1 | 0 | 18 |
| 1 | 0 | 1 | 0 | 1 | 21 |
| 1 | 1 | 0 | 0 | 1 | 25 |
| 1 | 1 | 1 | 1 | 1 | 31 |
**2. Bar Chart**
* **Y-Axis:** Labeled "Probability". The scale ranges from 0 to 0.2, with major ticks at 0, 0.05, 0.1, 0.15, and 0.2.
* **X-Axis:** Labeled "[C_i B A S C_o]". The axis displays the decimal values corresponding to the truth table: 0, 6, 10, 13, 18, 21, 25, 31.
* **Legend (Top-Right):**
* **Blue Bar:** "Boltzmann law" (Theoretical prediction).
* **Orange Bar:** "Measured (oscillators)" (Experimental data).
### Detailed Analysis
**Data Series Trends:**
* **Boltzmann law (Blue):** The blue bars are consistent in height across all eight labeled X-axis points (0, 6, 10, 13, 18, 21, 25, 31), maintaining a probability of approximately 0.12.
* **Measured (oscillators) (Orange):** The orange bars closely track the blue bars at all labeled points. At most points, the orange bar is nearly identical in height to the blue bar. At points 21 and 25, the orange bar is slightly lower than the blue bar. At point 31, the orange bar is slightly lower than the blue bar.
* **Noise/Intermediate States:** Between the primary labeled points (e.g., between 0 and 6, 6 and 10), there are very small, non-zero bars visible for both the Boltzmann law and the Measured data. These represent states with very low probability (near 0.005).
**Data Points (Approximate Probability Values):**
* **At 0:** Both ~0.12
* **At 6:** Both ~0.12
* **At 10:** Both ~0.12
* **At 13:** Both ~0.12
* **At 18:** Both ~0.12
* **At 21:** Blue ~0.12, Orange ~0.115
* **At 25:** Blue ~0.12, Orange ~0.125
* **At 31:** Blue ~0.12, Orange ~0.12
### Key Observations
* **High Correlation:** The experimental "Measured" data shows a very high degree of correlation with the theoretical "Boltzmann law" prediction.
* **Uniform Distribution:** The system appears to be designed to favor the eight specific states listed in the truth table, as these are the only states with significant probability mass.
* **State Leakage:** The presence of tiny bars between the primary states suggests "leakage" or transient states where the system briefly exists outside of the eight defined "valid" states.
### Interpretation
This visualization demonstrates the validation of a physical system (likely a network of coupled oscillators) against a theoretical model (Boltzmann law).
The truth table defines the "valid" states of a logic system. The bar chart shows that the system spends the vast majority of its time in these valid states, with a probability distribution that is nearly uniform across them. The close alignment between the blue (theoretical) and orange (measured) bars indicates that the oscillator system successfully mimics the statistical mechanics predicted by the Boltzmann law. The small, non-zero bars between the main peaks likely represent thermal noise or transient switching states in the physical hardware, which are expected in real-world implementations of such systems.