## Line Chart: Attention over Values, a=96
### Overview
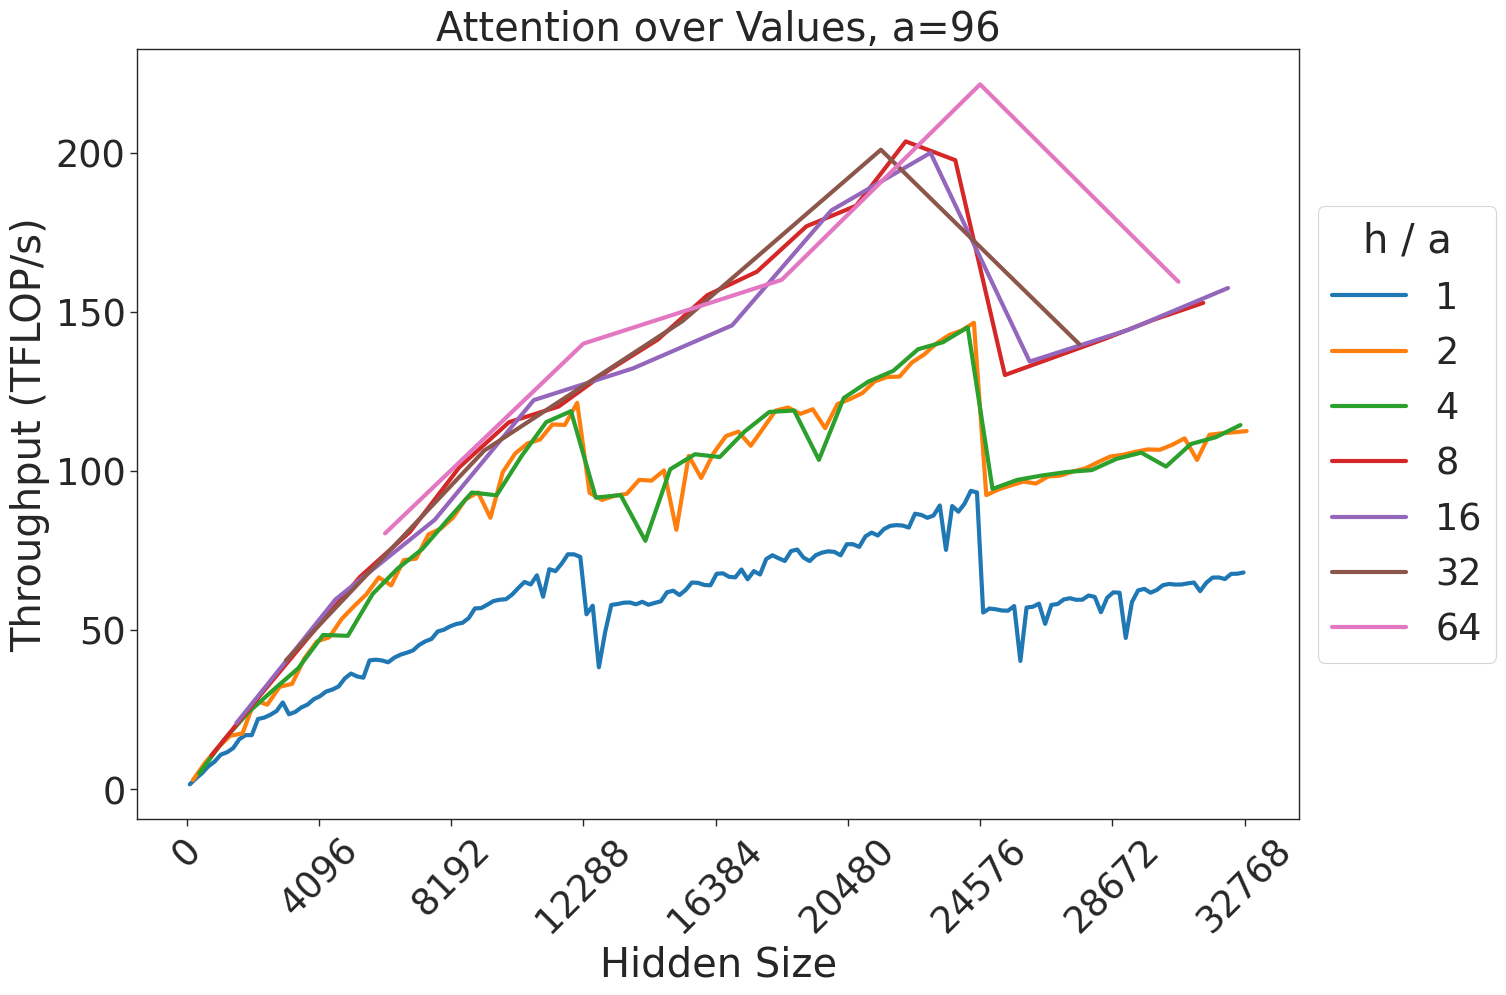
This image displays a line chart titled "Attention over Values, a=96". It plots the performance (Throughput in TFLOP/s) of an attention mechanism against varying "Hidden Size" parameters. The chart illustrates how different ratios of "h / a" (heads per attention block) affect computational throughput, revealing significant performance volatility at specific hidden size intervals.
### Components/Axes
* **Title:** "Attention over Values, a=96" (Centered at the top).
* **X-Axis:** Labeled "Hidden Size".
* Scale: 0, 4096, 8192, 12288, 16384, 20480, 24576, 28672, 32768.
* **Y-Axis:** Labeled "Throughput (TFLOP/s)".
* Scale: 0, 50, 100, 150, 200.
* **Legend:** Located on the right side of the chart. The legend title is "h / a".
* **Blue:** 1
* **Orange:** 2
* **Green:** 4
* **Red:** 8
* **Purple:** 16
* **Brown:** 32
* **Pink:** 64
### Detailed Analysis
The chart displays seven distinct data series representing different "h / a" ratios.
**Trend Verification:**
* **General Trend:** All lines exhibit a positive slope (upward trend) as the Hidden Size increases, indicating that larger hidden sizes generally allow for higher throughput, up to specific thresholds.
* **Sawtooth Pattern:** There are two distinct, sharp drops in throughput across almost all lines at Hidden Size **12288** and **24576**.
* **Clustering:** The lines are grouped into three performance tiers:
1. **Low Tier (Blue/1):** Consistently the lowest throughput, peaking just below 100 TFLOP/s.
2. **Mid Tier (Orange/2, Green/4):** These lines track closely together, peaking near 150 TFLOP/s before the drop at 24576.
3. **High Tier (Red/8, Purple/16, Brown/32, Pink/64):** These lines track together for the majority of the chart, achieving the highest throughput (exceeding 200 TFLOP/s).
**Data Point Observations:**
* **The 24576 Drop:** This is the most significant anomaly.
* The **Pink (64)** line reaches the highest peak on the chart (approx. 225 TFLOP/s) just before 24576, then drops sharply to approximately 130 TFLOP/s.
* The **Brown (32)** line follows a similar trajectory, peaking near 200 TFLOP/s and dropping to ~130 TFLOP/s.
* The **Red (8)** and **Purple (16)** lines also show a sharp decline at this point.
* **The 12288 Drop:** A smaller, but noticeable, drop occurs for all lines at this hidden size. For example, the Blue line drops from ~75 TFLOP/s to ~40 TFLOP/s.
### Key Observations
* **Performance Cliffs:** The sharp drops at 12288 and 24576 suggest that the underlying hardware or software kernel is highly sensitive to specific memory alignment or tiling boundaries. When the hidden size exceeds these multiples, the efficiency of the attention operation degrades significantly.
* **Diminishing Returns/Volatility:** While higher "h / a" ratios (32, 64) achieve higher peak throughput, they are also subject to the most dramatic performance penalties when the hidden size crosses the 24576 threshold.
* **Consistency:** The "h / a" ratio of 1 (Blue) is the most stable, showing the least amount of volatility, but it is also the least performant.
### Interpretation
This chart is a classic representation of a GPU kernel performance benchmark, likely for a FlashAttention-style implementation.
* **The "a=96" constraint:** This likely refers to a fixed block size or head dimension.
* **The "h/a" ratio:** This represents the number of heads relative to the block size. The data demonstrates that increasing the number of heads generally improves throughput by better saturating the GPU's compute units.
* **The "Cliffs":** The drops at 12288 and 24576 are almost certainly related to memory tiling. When the hidden size is a multiple of the tile size, the kernel runs efficiently. When the hidden size is slightly larger than a multiple, the kernel likely has to perform "remainder" operations or inefficient memory access patterns, causing the throughput to plummet.
* **Conclusion:** For optimal performance, developers should avoid hidden sizes that fall just past these "cliff" points (12288 and 24576). If a model requires a hidden size near these values, it may be more efficient to pad the hidden size to the next optimal boundary or reduce it to the previous one to maintain high throughput.