## Box Plot: Number of Goals by Agent Type
### Overview
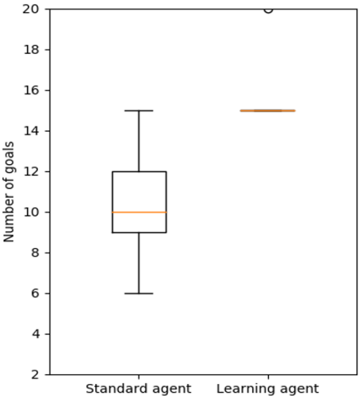
The image displays a comparative box plot analyzing the distribution of goals scored by two types of agents: "Standard agent" and "Learning agent." The y-axis represents the "Number of goals" (ranging from 2 to 20), while the x-axis categorizes the agents. The plot uses orange for median lines and black for box plot components.
### Components/Axes
- **X-axis (Categories)**:
- "Standard agent" (left)
- "Learning agent" (right)
- **Y-axis (Scale)**:
- Labeled "Number of goals"
- Range: 2 to 20 (in increments of 2)
- **Legend**: Not explicitly present, but colors are defined:
- **Orange**: Median line (central horizontal line in each box)
- **Black**: Box plot boundaries (whiskers, quartiles, and outliers)
### Detailed Analysis
1. **Standard Agent**:
- **Median**: ~10 (orange line within the box).
- **Interquartile Range (IQR)**: 8 (lower quartile) to 12 (upper quartile).
- **Whiskers**: Extend from 6 (minimum) to 14 (maximum), excluding outliers.
- **Outliers**: None visible.
2. **Learning Agent**:
- **Median**: ~14.5 (orange line).
- **Interquartile Range (IQR)**: Collapsed to a single line at ~14.5, indicating no variability in the middle 50% of data.
- **Whiskers**: Extend from ~14.5 to 20 (maximum), with an outlier at 20.
- **Outliers**: One data point at 20 (marked as a circle above the whisker).
### Key Observations
- The **Learning agent** consistently scores more goals than the Standard agent, with a higher median (~14.5 vs. ~10).
- The **Standard agent** shows moderate variability (IQR: 8–12), while the Learning agent’s performance is tightly clustered around 14.5.
- The **outlier at 20** for the Learning agent suggests an exceptional case, potentially skewing the distribution.
### Interpretation
The data suggests that the Learning agent outperforms the Standard agent in goal-scoring tasks, with a higher central tendency and reduced variability. However, the outlier at 20 for the Learning agent warrants investigation—it could indicate an anomaly or a rare high-performing scenario. The Standard agent’s broader IQR implies less consistency, possibly due to less adaptive learning mechanisms. The absence of a legend complicates direct color-to-label mapping, but the orange median lines and black box components are visually distinct. This plot highlights the Learning agent’s superiority but raises questions about the outlier’s validity and the Standard agent’s reliability.