\n
## Charts: Model Performance vs. Data & Compute
### Overview
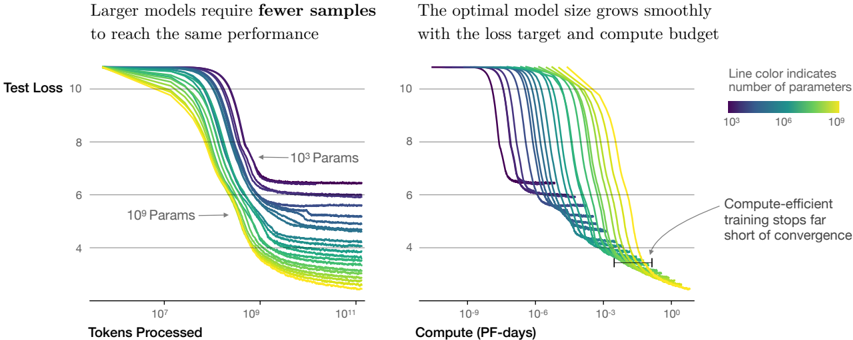
The image presents two charts comparing the performance of machine learning models with varying numbers of parameters. The left chart shows Test Loss as a function of Tokens Processed, while the right chart shows Test Loss as a function of Compute (in PF-days). Both charts aim to demonstrate the relationship between model size, data usage, compute resources, and performance (measured by Test Loss).
### Components/Axes
* **Left Chart:**
* **Title:** "Larger models require fewer samples to reach the same performance"
* **X-axis:** "Tokens Processed" (logarithmic scale, ranging approximately from 10<sup>6</sup> to 10<sup>11</sup>)
* **Y-axis:** "Test Loss" (linear scale, ranging approximately from 4 to 10)
* **Data Series:** Multiple lines representing different model sizes.
* **Labels:** "10<sup>3</sup> Params" and "10<sup>9</sup> Params" are indicated with arrows pointing to representative lines.
* **Right Chart:**
* **Title:** "The optimal model size grows smoothly with the loss target and compute budget"
* **X-axis:** "Compute (PF-days)" (logarithmic scale, ranging approximately from 10<sup>-9</sup> to 10<sup>1</sup>)
* **Y-axis:** "Test Loss" (linear scale, ranging approximately from 4 to 10)
* **Data Series:** Multiple lines representing different model sizes.
* **Legend:** Located on the right side, indicating that "Line color indicates number of parameters". The legend shows a color gradient from purple (10<sup>3</sup>) to green (10<sup>9</sup>).
* **Annotation:** "Compute-efficient training stops far short of convergence" with an arrow pointing to a line that plateaus at a higher loss value.
### Detailed Analysis or Content Details
**Left Chart (Test Loss vs. Tokens Processed):**
* **Trend:** All lines generally slope downwards, indicating that Test Loss decreases as more tokens are processed. The lines representing larger models (green) reach lower loss values faster than those representing smaller models (purple).
* **Data Points (approximate):**
* **10<sup>3</sup> Params (purple):** Starts around Test Loss = 9.5, reaches approximately Test Loss = 5.5 at 10<sup>11</sup> Tokens Processed.
* **10<sup>9</sup> Params (green):** Starts around Test Loss = 9.5, reaches approximately Test Loss = 4.0 at 10<sup>9</sup> Tokens Processed.
* **Observation:** The lines are densely packed at the beginning (low token count) and spread out as the token count increases, suggesting diminishing returns for larger models.
**Right Chart (Test Loss vs. Compute):**
* **Trend:** Similar to the left chart, all lines slope downwards. Larger models (green) achieve lower loss values with less compute.
* **Data Points (approximate):**
* **10<sup>3</sup> Params (purple):** Starts around Test Loss = 9.5, reaches approximately Test Loss = 5.5 at 10<sup>1</sup> PF-days.
* **10<sup>9</sup> Params (green):** Starts around Test Loss = 9.5, reaches approximately Test Loss = 4.0 at 10<sup>-3</sup> PF-days.
* **Annotation:** The annotated line (yellowish-green) plateaus around Test Loss = 6.0, indicating that further compute investment does not significantly reduce loss.
**Color Mapping:** The color gradient in the legend (purple to green) corresponds to increasing model size (10<sup>3</sup> to 10<sup>9</sup> parameters). This color mapping is consistent across both charts.
### Key Observations
* Larger models converge faster (reach lower loss values) with both increased data (tokens processed) and increased compute.
* The relationship between model size, data, and compute appears smooth and predictable.
* Compute-efficient training can lead to suboptimal results, as indicated by the plateauing line in the right chart.
* The logarithmic scales on the x-axes highlight the significant differences in scale between the two charts.
### Interpretation
The data strongly suggests that increasing model size is an effective strategy for improving performance, but it comes with increased computational cost. The charts demonstrate a trade-off between model size, data requirements, and compute resources. Larger models can achieve the same level of performance as smaller models with less data and compute. However, the annotation on the right chart warns against prematurely stopping training, as this can result in a model that has not fully converged and therefore performs suboptimally. The smooth growth of the optimal model size with loss target and compute budget suggests a predictable scaling relationship that can be leveraged for efficient model development. The use of logarithmic scales indicates that the benefits of increased data and compute diminish as these resources become larger, suggesting that there may be a point of diminishing returns.