## Line Charts: Attention Weight Comparison with and without Meaningless Tokens
### Overview
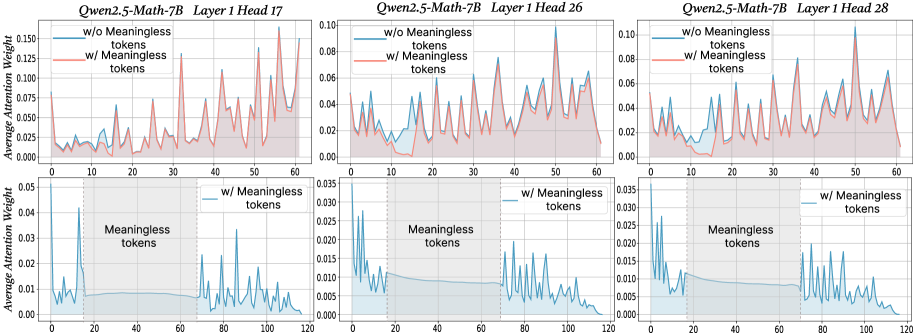
The image presents three pairs of line charts, each comparing the average attention weight of a language model (Qwen2.5-Math-7B) with and without "meaningless tokens." Each pair corresponds to a different attention head (17, 26, and 28) within Layer 1 of the model. The top row of charts displays data up to an x-axis value of 60, while the bottom row extends to 120, focusing on the "meaningless tokens" region.
### Components/Axes
**General Structure:**
* The image is divided into three columns, each representing a different attention head: 17, 26, and 28.
* Each column contains two line charts: one showing data up to x=60 and the other up to x=120.
* Each chart plots "Average Attention Weight" on the y-axis against an unspecified x-axis (likely token position or index).
**Axes:**
* **Y-axis (Average Attention Weight):**
* Top Row: Ranges from 0.000 to 0.150 (Head 17), 0.00 to 0.10 (Head 26), and 0.00 to 0.10 (Head 28). Increments are 0.025 (Head 17) and 0.02 (Head 26, 28).
* Bottom Row: Ranges from 0.000 to 0.05 (Head 17), 0.000 to 0.035 (Head 26), and 0.000 to 0.035 (Head 28). Increments are 0.01 (Head 17) and 0.005 (Head 26, 28).
* **X-axis:**
* Top Row: Ranges from 0 to 60, with increments of 10.
* Bottom Row: Ranges from 0 to 120, with increments of 20.
**Legends (Located in the top-right of each of the top charts):**
* **Blue Line:** "w/o Meaningless tokens" (without Meaningless tokens)
* **Red Line:** "w/ Meaningless tokens" (with Meaningless tokens)
* **Bottom Row:** "w/ Meaningless tokens" (without Meaningless tokens)
**Titles:**
* Top-left: "Qwen2.5-Math-7B Layer 1 Head 17"
* Top-middle: "Qwen2.5-Math-7B Layer 1 Head 26"
* Top-right: "Qwen2.5-Math-7B Layer 1 Head 28"
**Annotations:**
* The bottom charts have a shaded gray region labeled "Meaningless tokens" spanning approximately from x=20 to x=70.
### Detailed Analysis
**Head 17 (Left Column):**
* **Top Chart (0-60):**
* Blue Line (w/o Meaningless tokens): Relatively low and stable, generally below 0.025, with some small peaks.
* Red Line (w/ Meaningless tokens): Exhibits significantly higher peaks, reaching up to 0.15, and is generally above the blue line.
* **Bottom Chart (0-120):**
* Blue Line (w/ Meaningless tokens): Starts high (around 0.05) and rapidly decreases to a low level within the "Meaningless tokens" region, then fluctuates at a low level for the remainder of the chart.
**Head 26 (Middle Column):**
* **Top Chart (0-60):**
* Blue Line (w/o Meaningless tokens): More variable than in Head 17, with several peaks, but generally stays below 0.04.
* Red Line (w/ Meaningless tokens): Closely follows the blue line, with slightly higher peaks in some areas.
* **Bottom Chart (0-120):**
* Blue Line (w/ Meaningless tokens): Starts high (around 0.035) and decreases within the "Meaningless tokens" region, then fluctuates at a low level for the remainder of the chart, similar to Head 17.
**Head 28 (Right Column):**
* **Top Chart (0-60):**
* Blue Line (w/o Meaningless tokens): Similar to Head 26, with several peaks and valleys, generally below 0.04.
* Red Line (w/ Meaningless tokens): Closely follows the blue line, with slightly higher peaks in some areas.
* **Bottom Chart (0-120):**
* Blue Line (w/ Meaningless tokens): Starts high (around 0.035) and decreases within the "Meaningless tokens" region, then fluctuates at a low level for the remainder of the chart, similar to Heads 17 and 26.
### Key Observations
* **Head 17:** The presence of "meaningless tokens" significantly increases the average attention weight in the top chart (0-60).
* **Heads 26 & 28:** The presence of "meaningless tokens" has a smaller impact on the average attention weight in the top charts (0-60) compared to Head 17. The red and blue lines are much closer.
* **Bottom Charts (Heads 17, 26, & 28):** In all three heads, the attention weight is high initially and decreases within the "Meaningless tokens" region in the bottom charts (0-120).
### Interpretation
The charts illustrate how the presence of "meaningless tokens" affects the attention weights within different attention heads of the Qwen2.5-Math-7B language model.
* **Head Specialization:** Head 17 appears to be more sensitive to "meaningless tokens" than Heads 26 and 28, as indicated by the larger difference between the "with" and "without" lines in the top chart. This suggests that different attention heads may specialize in processing different types of information.
* **Attention Suppression:** The bottom charts suggest that the model initially attends to these "meaningless tokens" but then reduces attention within the defined region (x=20 to x=70). This could indicate a mechanism for filtering out or down-weighting irrelevant information.
* **Contextual Understanding:** The model's behavior suggests it can identify and potentially ignore "meaningless tokens" after an initial processing stage. This is crucial for efficient and accurate language understanding.
* **Further Investigation:** It would be beneficial to understand what constitutes a "meaningless token" in this context. Analyzing the specific tokens and their impact on other layers and heads could provide deeper insights into the model's attention mechanisms.