## Chart: Metric Value and Normalized MFPT/WHR vs. Lambda (log scale) for Different Tau Values
### Overview
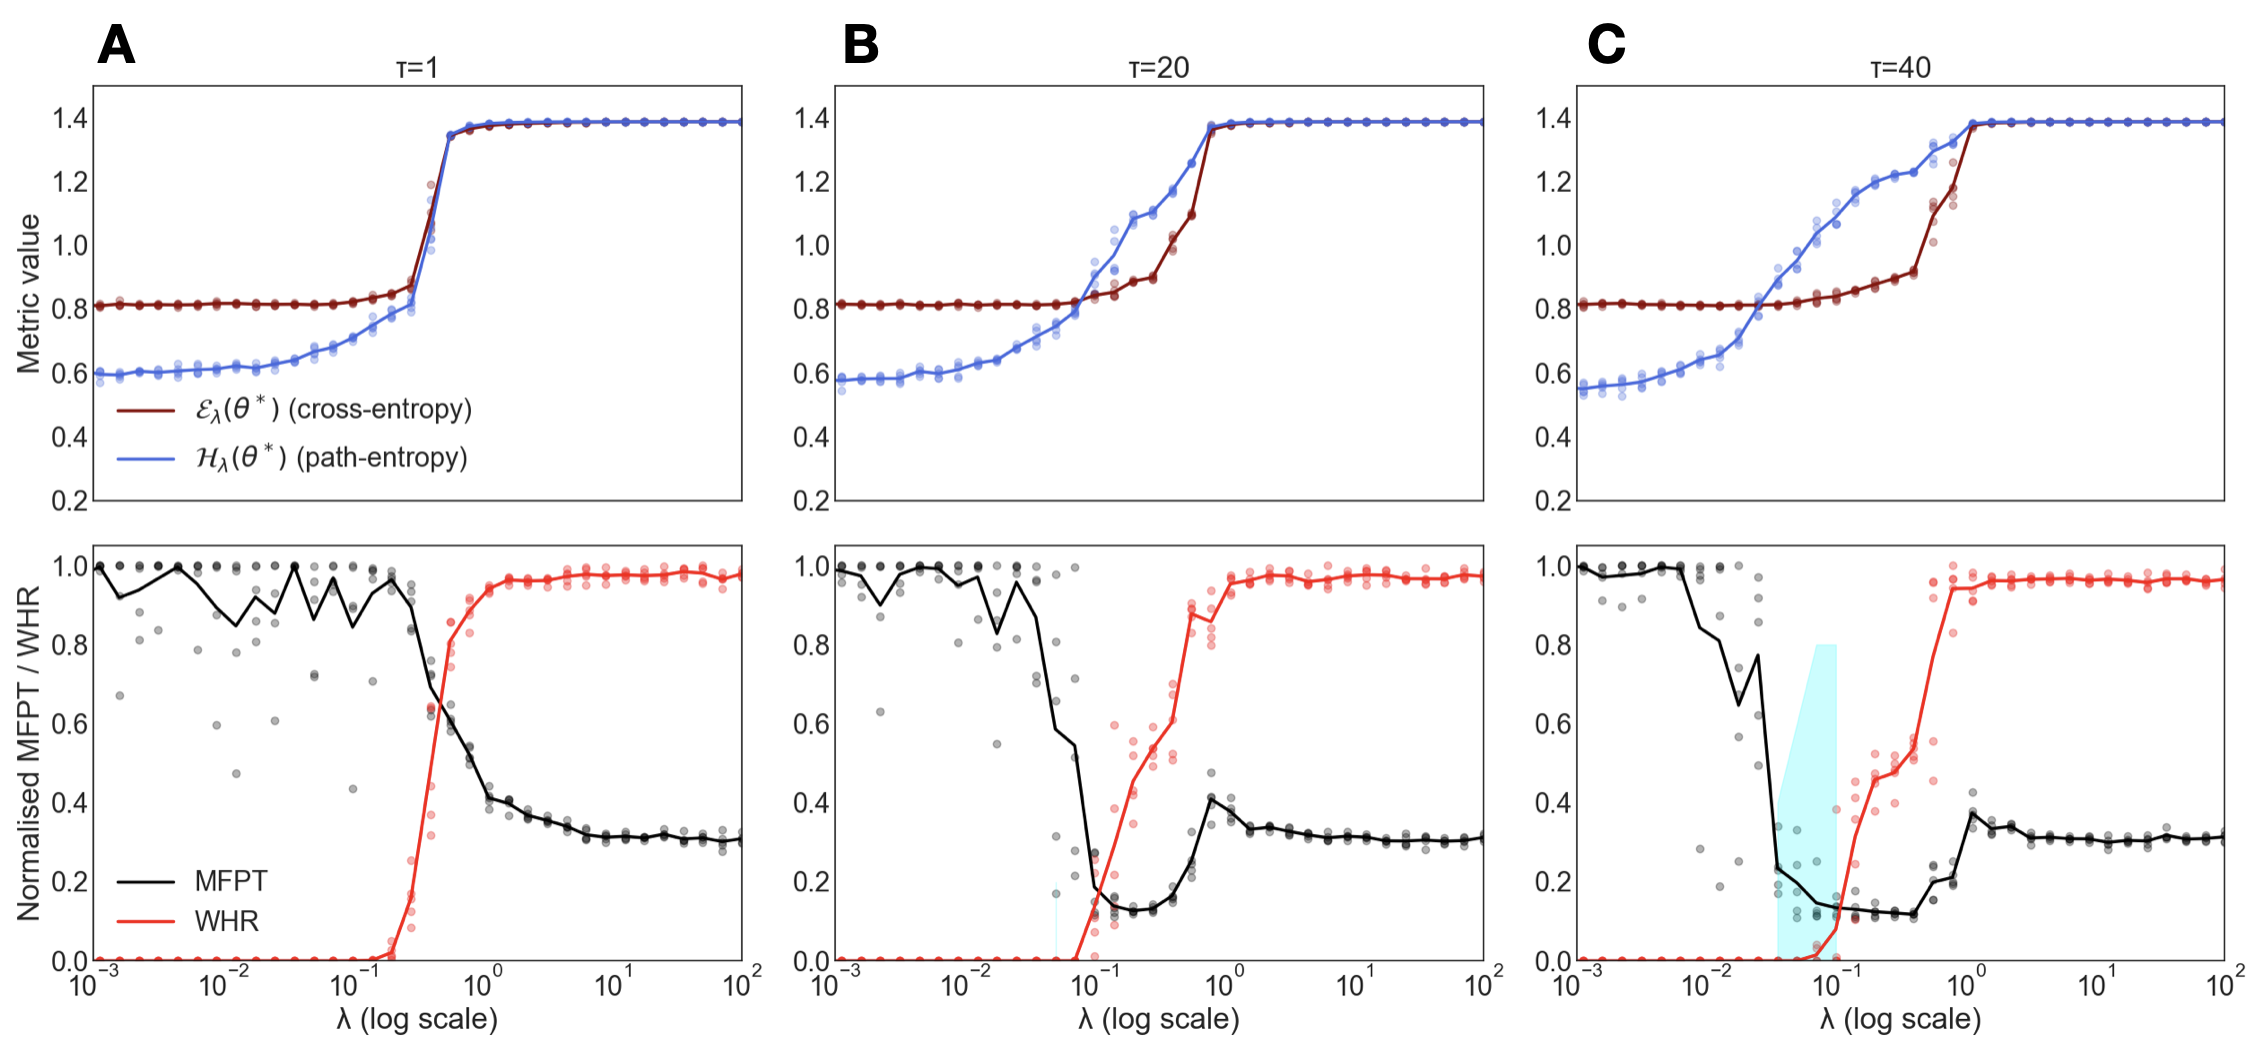
The image presents three sets of two line graphs (six graphs total), arranged side-by-side, labeled A, B, and C. Each set of graphs displays the relationship between a metric value (top graph) or normalized MFPT/WHR (bottom graph) and lambda (λ) on a logarithmic scale. The three sets of graphs correspond to different values of tau (τ): 1, 20, and 40. The top graph in each set shows the cross-entropy and path-entropy, while the bottom graph shows the MFPT and WHR.
### Components/Axes
**General Layout:**
* The image is divided into three columns, labeled A, B, and C at the top-left of each column.
* Each column contains two line graphs, one above the other.
**Top Graphs (Metric Value vs. Lambda):**
* **Y-axis (Metric value):** Linear scale ranging from 0.2 to 1.4.
* **X-axis (λ (log scale)):** Logarithmic scale ranging from 10^-3 to 10^2.
* **Legend (Top-Left of the top graph):**
* Red line: ελ(θ*) (cross-entropy)
* Blue line: Hλ(θ*) (path-entropy)
**Bottom Graphs (Normalized MFPT/WHR vs. Lambda):**
* **Y-axis (Normalized MFPT / WHR):** Linear scale ranging from 0.0 to 1.0.
* **X-axis (λ (log scale)):** Logarithmic scale ranging from 10^-3 to 10^2.
* **Legend (Bottom-Left of the bottom graph):**
* Black line: MFPT
* Red line: WHR
**Titles:**
* A: τ=1
* B: τ=20
* C: τ=40
### Detailed Analysis
**Graph A (τ=1):**
* **Top Graph:**
* Cross-entropy (red line): Starts at approximately 0.8, remains relatively constant until λ ≈ 10^-1, then increases sharply to approximately 1.35 and remains constant.
* Path-entropy (blue line): Starts at approximately 0.6, remains relatively constant until λ ≈ 10^-1, then increases sharply to approximately 1.35 and remains constant.
* **Bottom Graph:**
* MFPT (black line): Starts at approximately 1.0, fluctuates around 1.0 until λ ≈ 10^-1, then decreases sharply to approximately 0.3 and remains constant.
* WHR (red line): Starts at approximately 0.0, remains at 0.0 until λ ≈ 10^-1, then increases sharply to approximately 1.0 and remains constant.
**Graph B (τ=20):**
* **Top Graph:**
* Cross-entropy (red line): Starts at approximately 0.8, remains relatively constant until λ ≈ 10^0, then increases sharply to approximately 1.4 and remains constant.
* Path-entropy (blue line): Starts at approximately 0.6, increases gradually until λ ≈ 10^0, then increases sharply to approximately 1.4 and remains constant.
* **Bottom Graph:**
* MFPT (black line): Starts at approximately 1.0, fluctuates around 1.0 until λ ≈ 10^-1, then decreases sharply to approximately 0.4 and remains constant.
* WHR (red line): Starts at approximately 0.0, remains at 0.0 until λ ≈ 10^-1, then increases sharply to approximately 1.0 and remains constant.
**Graph C (τ=40):**
* **Top Graph:**
* Cross-entropy (red line): Starts at approximately 0.8, remains relatively constant until λ ≈ 10^0, then increases sharply to approximately 1.4 and remains constant.
* Path-entropy (blue line): Starts at approximately 0.6, increases gradually until λ ≈ 10^0, then increases sharply to approximately 1.4 and remains constant.
* **Bottom Graph:**
* MFPT (black line): Starts at approximately 1.0, fluctuates around 1.0 until λ ≈ 10^-1, then decreases sharply to approximately 0.3 and remains constant.
* WHR (red line): Starts at approximately 0.0, remains at 0.0 until λ ≈ 10^-1, then increases sharply to approximately 1.0 and remains constant.
### Key Observations
* In all three cases, the cross-entropy and path-entropy increase sharply at a certain value of lambda. The value of lambda at which this increase occurs shifts to the right (higher values) as tau increases.
* In all three cases, the MFPT decreases sharply and the WHR increases sharply at approximately the same value of lambda.
* The transition point for MFPT/WHR shifts to higher lambda values as tau increases.
* The shaded blue region in the bottom graph of C highlights an area of interest where the MFPT and WHR transition occurs.
### Interpretation
The graphs illustrate the relationship between different metrics (cross-entropy, path-entropy, MFPT, and WHR) and the parameter lambda (λ) for different values of tau (τ). The data suggests that as lambda increases, there is a transition point where the system's behavior changes significantly. This transition point is characterized by a sharp increase in cross-entropy and path-entropy, a sharp decrease in MFPT, and a sharp increase in WHR.
The shift of this transition point to higher lambda values as tau increases indicates that the system's sensitivity to lambda changes with tau. In other words, the system requires a higher value of lambda to induce the same change in behavior when tau is larger. This could be due to the system having a longer "memory" or being more resistant to changes in lambda when tau is larger.
The relationship between MFPT and WHR is also notable. The inverse relationship suggests that as the mean first passage time (MFPT) decreases, the work-height ratio (WHR) increases, indicating a change in the system's efficiency or performance.