## Matrix Decomposition Diagram
### Overview
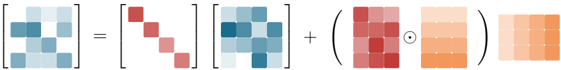
The image depicts a matrix decomposition equation. A 4x4 matrix, represented by blue-toned squares, is decomposed into the sum of a diagonal matrix (represented by red-toned squares) and the element-wise (Hadamard) product of two other 4x4 matrices (represented by red and orange-toned squares).
### Components/Axes
* **Matrices:** The image contains several 4x4 matrices, each represented by a grid of 16 squares.
* **Color Gradient:** The color of each square within a matrix represents a value. Blue represents lower values, red and orange represent higher values.
* **Operators:** The equation includes the following operators:
* "=" (equals sign)
* "+" (addition)
* "⊙" (Hadamard product, element-wise multiplication)
* **Brackets:** Square brackets denote matrices, and parentheses group the Hadamard product.
### Detailed Analysis or ### Content Details
1. **Original Matrix (Leftmost):** A 4x4 matrix with varying shades of blue. The values are not uniform, with some squares being darker blue than others.
* Top-left: Light blue
* Top-right: Light blue
* Bottom-left: Darker blue
* Bottom-right: Light blue
2. **Diagonal Matrix:** A 4x4 diagonal matrix with shades of red. Only the diagonal elements have non-zero values.
* Top-left: Dark red
* Second row, second column: Medium red
* Third row, third column: Light red
* Bottom-right: Very light red
3. **Second Matrix (Addition):** A 4x4 matrix with varying shades of blue, similar to the original matrix.
* Top-left: Dark blue
* Top-right: Light blue
* Bottom-left: Light blue
* Bottom-right: Dark blue
4. **Hadamard Product Matrices:** Two 4x4 matrices enclosed in parentheses, combined using the Hadamard product operator.
* First Matrix: Shades of red, with the top-left being the darkest and the bottom-right being the lightest.
* Second Matrix: Shades of orange, with the top-left being the lightest and the bottom-right being the darkest.
### Key Observations
* The original matrix is decomposed into a diagonal matrix and the Hadamard product of two other matrices.
* The color gradients within each matrix suggest varying values for each element.
* The diagonal matrix only has non-zero values along its diagonal.
* The Hadamard product matrices have opposing color gradients (red increasing downwards, orange increasing rightwards).
### Interpretation
The image illustrates a matrix decomposition technique, likely used in linear algebra or machine learning. The decomposition separates the original matrix into a diagonal component and a component derived from the element-wise product of two other matrices. This type of decomposition can be useful for simplifying matrix operations, reducing dimensionality, or extracting specific features from the original matrix. The Hadamard product suggests an element-wise interaction between the two matrices, potentially capturing relationships or dependencies between different elements. The specific application of this decomposition would depend on the context in which it is used.