## Chart: Scaling of Parameters and Steps with Compute
### Overview
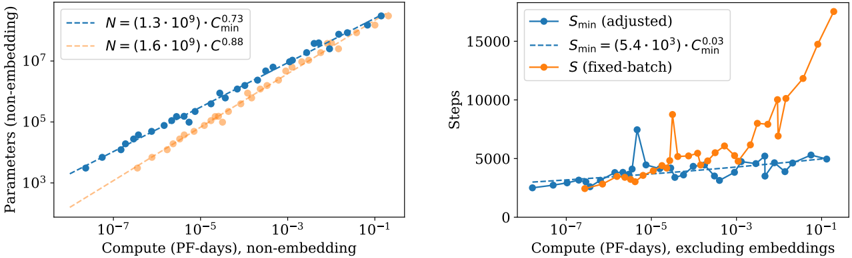
The image presents two charts side-by-side, both examining the relationship between compute (measured in PF-days) and either the number of parameters (left chart) or the number of steps (right chart). Both charts display data for different configurations, indicated by different colored lines and associated equations. The left chart focuses on parameter scaling, while the right chart focuses on step scaling.
### Components/Axes
**Left Chart:**
* **X-axis:** Compute (PF-days), non-embedding. Scale is logarithmic, ranging from approximately 10<sup>-7</sup> to 10<sup>-1</sup>.
* **Y-axis:** Parameters (non-embedding). Scale is logarithmic, ranging from approximately 10<sup>3</sup> to 10<sup>5</sup>.
* **Lines/Legends:**
* Blue dashed line: N = (1.3 * 10<sup>9</sup>) * C<sub>min</sub><sup>0.73</sup>
* Orange dashed line: N = (1.6 * 10<sup>9</sup>) * C<sub>min</sub><sup>0.88</sup>
**Right Chart:**
* **X-axis:** Compute (PF-days), excluding embeddings. Scale is logarithmic, ranging from approximately 10<sup>-7</sup> to 10<sup>-1</sup>.
* **Y-axis:** Steps. Scale is linear, ranging from 0 to 15000.
* **Lines/Legends:**
* Blue dashed line: S<sub>min</sub> (adjusted) = (5.4 * 10<sup>3</sup>) * C<sub>min</sub><sup>0.03</sup>
* Orange solid line: S (fixed-batch)
### Detailed Analysis or Content Details
**Left Chart (Parameters vs. Compute):**
* The blue line (N = (1.3 * 10<sup>9</sup>) * C<sub>min</sub><sup>0.73</sup>) starts at approximately 10<sup>3.2</sup> parameters at 10<sup>-7</sup> PF-days and rises to approximately 10<sup>4.8</sup> parameters at 10<sup>-1</sup> PF-days. The line exhibits a generally upward trend, with a slight concavity.
* The orange line (N = (1.6 * 10<sup>9</sup>) * C<sub>min</sub><sup>0.88</sup>) starts at approximately 10<sup>3</sup> parameters at 10<sup>-7</sup> PF-days and rises to approximately 10<sup>5</sup> parameters at 10<sup>-1</sup> PF-days. This line also exhibits an upward trend, but is steeper than the blue line, especially at higher compute values.
**Right Chart (Steps vs. Compute):**
* The blue line (S<sub>min</sub> (adjusted) = (5.4 * 10<sup>3</sup>) * C<sub>min</sub><sup>0.03</sup>) starts at approximately 2000 steps at 10<sup>-7</sup> PF-days, dips to around 1500 steps at 10<sup>-5</sup> PF-days, then rises to approximately 4000 steps at 10<sup>-1</sup> PF-days. The line is relatively flat initially, then shows some fluctuations before a slight increase.
* The orange line (S (fixed-batch)) starts at approximately 2500 steps at 10<sup>-7</sup> PF-days, remains relatively stable until approximately 10<sup>-3</sup> PF-days, then increases sharply to approximately 14000 steps at 10<sup>-1</sup> PF-days. This line shows a much more pronounced increase in steps at higher compute values.
### Key Observations
* Both charts demonstrate a positive correlation between compute and the respective metrics (parameters and steps).
* The parameter scaling (left chart) shows that the orange configuration (higher coefficient) requires more parameters than the blue configuration for a given compute value.
* The step scaling (right chart) shows a significant divergence between the adjusted (blue) and fixed-batch (orange) approaches at higher compute values, with the fixed-batch approach requiring substantially more steps.
* The adjusted step scaling (blue line, right chart) exhibits a dip in steps around 10<sup>-5</sup> PF-days, suggesting a potential optimization or efficiency gain at that compute level.
### Interpretation
The data suggests that increasing compute leads to increased model size (parameters) and training effort (steps). The two parameter scaling curves (left chart) indicate different scaling efficiencies, with the orange curve representing a configuration that requires more parameters for a given compute budget. The right chart highlights the trade-offs between different step scaling strategies. The fixed-batch approach (orange line) becomes significantly more expensive in terms of steps as compute increases, while the adjusted approach (blue line) maintains a more moderate increase. The dip in the adjusted step scaling curve around 10<sup>-5</sup> PF-days could indicate a point where algorithmic optimizations become effective, reducing the number of steps needed for a given level of compute. The equations provided suggest that both parameters and steps scale with C<sub>min</sub> to some power, indicating that the minimum compute unit plays a role in determining the overall resource requirements. The difference in exponents (0.73 vs 0.88 for parameters, and 0.03 for steps) suggests that parameters are more sensitive to changes in C<sub>min</sub> than steps.