## Line Chart: Accuracy vs. Sample Size
### Overview
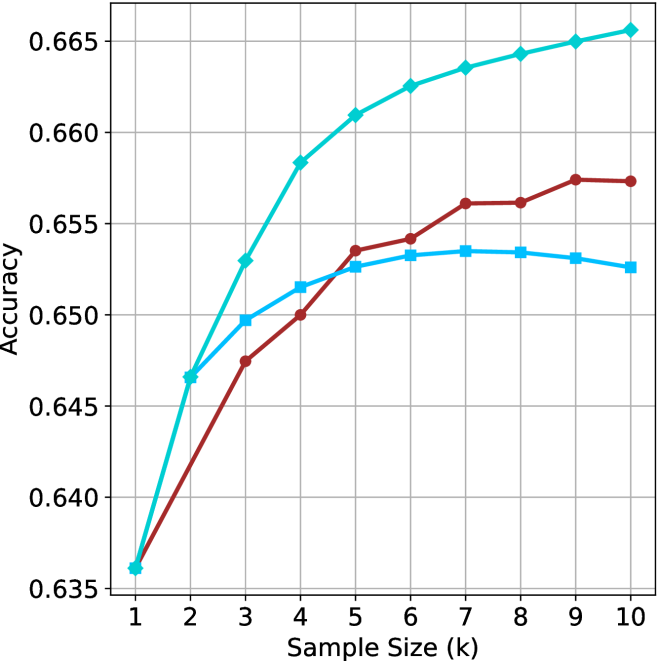
The image is a line chart showing the relationship between "Accuracy" and "Sample Size (k)". There are three distinct data series represented by different colored lines: a turquoise line with diamond markers, a light blue line with square markers, and a brown line with circular markers. The chart displays how accuracy changes with increasing sample size for each of the three series.
### Components/Axes
* **X-axis:** "Sample Size (k)" with integer values from 1 to 10.
* **Y-axis:** "Accuracy" with values ranging from 0.635 to 0.665, in increments of 0.005.
* **Data Series:**
* Turquoise line with diamond markers.
* Light blue line with square markers.
* Brown line with circular markers.
* **Grid:** The chart has a grid to aid in reading the values.
### Detailed Analysis
**Turquoise Line (Diamond Markers):**
This line shows a generally upward trend, indicating that accuracy increases with sample size.
* At Sample Size 1, Accuracy is approximately 0.637.
* At Sample Size 2, Accuracy is approximately 0.647.
* At Sample Size 3, Accuracy is approximately 0.653.
* At Sample Size 4, Accuracy is approximately 0.658.
* At Sample Size 5, Accuracy is approximately 0.661.
* At Sample Size 6, Accuracy is approximately 0.663.
* At Sample Size 7, Accuracy is approximately 0.664.
* At Sample Size 8, Accuracy is approximately 0.6645.
* At Sample Size 9, Accuracy is approximately 0.665.
* At Sample Size 10, Accuracy is approximately 0.6655.
**Light Blue Line (Square Markers):**
This line initially increases, plateaus, and then slightly decreases.
* At Sample Size 1, Accuracy is approximately 0.637.
* At Sample Size 2, Accuracy is approximately 0.650.
* At Sample Size 3, Accuracy is approximately 0.652.
* At Sample Size 4, Accuracy is approximately 0.653.
* At Sample Size 5, Accuracy is approximately 0.6535.
* At Sample Size 6, Accuracy is approximately 0.6535.
* At Sample Size 7, Accuracy is approximately 0.6535.
* At Sample Size 8, Accuracy is approximately 0.6535.
* At Sample Size 9, Accuracy is approximately 0.653.
* At Sample Size 10, Accuracy is approximately 0.6525.
**Brown Line (Circular Markers):**
This line shows an increasing trend, then plateaus.
* At Sample Size 1, Accuracy is approximately 0.637.
* At Sample Size 2, Accuracy is approximately 0.647.
* At Sample Size 3, Accuracy is approximately 0.649.
* At Sample Size 4, Accuracy is approximately 0.6515.
* At Sample Size 5, Accuracy is approximately 0.6535.
* At Sample Size 6, Accuracy is approximately 0.6545.
* At Sample Size 7, Accuracy is approximately 0.656.
* At Sample Size 8, Accuracy is approximately 0.656.
* At Sample Size 9, Accuracy is approximately 0.6575.
* At Sample Size 10, Accuracy is approximately 0.6575.
### Key Observations
* The turquoise line consistently outperforms the other two in terms of accuracy across all sample sizes.
* The light blue line plateaus and slightly decreases after a sample size of 7.
* The brown line plateaus after a sample size of 9.
* All three lines start at approximately the same accuracy for a sample size of 1.
### Interpretation
The chart suggests that increasing the sample size generally improves accuracy, but the extent of improvement varies depending on the specific data series (potentially representing different models or algorithms). The turquoise line demonstrates the most significant and consistent improvement in accuracy with increasing sample size, indicating it may be the most effective model. The plateauing or slight decrease in accuracy for the other two lines suggests that there may be a point of diminishing returns or overfitting occurring as the sample size increases beyond a certain point. The fact that all three lines start at the same accuracy for a sample size of 1 suggests that the models perform similarly with very small datasets.