## Chart: Property Verification Performance
### Overview
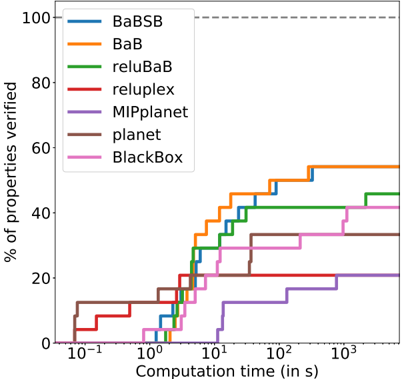
The image presents a line chart comparing the performance of seven different methods (BaBSB, BaB, reluBaB, reluplex, MIPplanet, planet, and BlackBox) in verifying properties. The x-axis represents computation time in seconds (logarithmic scale), and the y-axis represents the percentage of properties verified. The chart illustrates how quickly each method can verify a certain percentage of properties.
### Components/Axes
* **X-axis:** Computation time (in s), logarithmic scale ranging from 10<sup>-1</sup> to 10<sup>3</sup>.
* **Y-axis:** % of properties verified, linear scale ranging from 0 to 100.
* **Legend:** Located in the top-right corner, listing the following methods with corresponding colors:
* BaBSB (Blue)
* BaB (Orange)
* reluBaB (Green)
* reluplex (Red)
* MIPplanet (Purple)
* planet (Brown)
* BlackBox (Pink)
### Detailed Analysis
The chart displays seven distinct lines, each representing a method's performance.
* **BaBSB (Blue):** Starts at approximately 10% verified at 10<sup>-1</sup> s, rises sharply to around 60% at 10<sup>1</sup> s, plateaus around 50-60% for the remainder of the time.
* **BaB (Orange):** Starts at approximately 10% verified at 10<sup>-1</sup> s, rises to around 40% at 10<sup>1</sup> s, and then plateaus around 40-50% for the remainder of the time.
* **reluBaB (Green):** Starts at approximately 0% verified at 10<sup>-1</sup> s, rises to around 30% at 10<sup>1</sup> s, and then plateaus around 40-50% for the remainder of the time.
* **reluplex (Red):** Starts at approximately 10% verified at 10<sup>-1</sup> s, rises to around 30% at 10<sup>1</sup> s, and then plateaus around 30-40% for the remainder of the time.
* **MIPplanet (Purple):** Starts at approximately 0% verified at 10<sup>-1</sup> s, rises to around 20% at 10<sup>1</sup> s, and then plateaus around 20-30% for the remainder of the time.
* **planet (Brown):** Starts at approximately 10% verified at 10<sup>-1</sup> s, rises to around 20% at 10<sup>1</sup> s, and then plateaus around 20-30% for the remainder of the time.
* **BlackBox (Pink):** Starts at approximately 10% verified at 10<sup>-1</sup> s, rises to around 30% at 10<sup>1</sup> s, and then plateaus around 30-40% for the remainder of the time.
### Key Observations
* BaBSB consistently outperforms the other methods, achieving the highest percentage of properties verified, especially at longer computation times.
* BaB, reluBaB, reluplex, and BlackBox show similar performance, plateauing around 40-50% verified properties.
* MIPplanet and planet exhibit the lowest performance, with a plateau around 20-30% verified properties.
* All methods show a steep initial increase in verified properties as computation time increases from 10<sup>-1</sup> to 10<sup>1</sup> s.
### Interpretation
The chart demonstrates the trade-off between computation time and the percentage of properties verified for different property verification methods. BaBSB appears to be the most efficient method, capable of verifying a larger percentage of properties within a given time frame. The plateauing of all methods suggests that there is a limit to the number of properties that can be verified, even with increased computation time. This could be due to the inherent complexity of the properties themselves or limitations in the verification algorithms. The significant difference in performance between BaBSB and the other methods suggests that the specific techniques employed by BaBSB are particularly effective for this type of property verification task. The logarithmic scale on the x-axis highlights the importance of initial computation time; methods that show rapid improvement in the 10<sup>-1</sup> to 10<sup>1</sup> s range are likely to be more practical for real-time or time-sensitive applications.