## Line Chart: Percentage of Properties Verified vs. Computation Time
### Overview
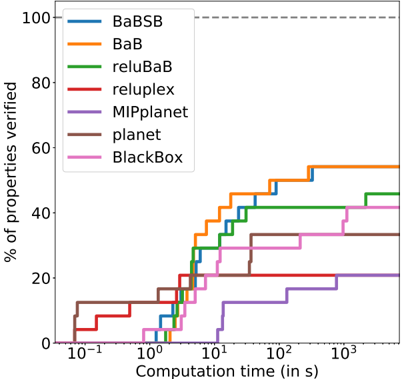
The chart compares the efficiency of seven computational methods (BaBSB, BaB, reluBaB, reluplex, MIPplanet, planet, BlackBox) in verifying properties over varying computation times. The y-axis represents the percentage of properties verified (0–100%), while the x-axis shows computation time in seconds on a logarithmic scale (10⁻¹ to 10³ s). Each method is represented by a distinct colored line, with steps indicating incremental progress in verification.
### Components/Axes
- **X-axis**: "Computation time (in s)" with logarithmic scale (10⁻¹, 10⁰, 10¹, 10², 10³ s).
- **Y-axis**: "% of properties verified" (0–100%).
- **Legend**:
- Blue: BaBSB
- Orange: BaB
- Green: reluBaB
- Red: reluplex
- Purple: MIPplanet
- Brown: planet
- Pink: BlackBox
### Detailed Analysis
1. **BaBSB (Blue)**:
- Starts at 0% at 10⁻¹ s.
- Reaches 20% at 10⁰ s.
- Jumps to 40% at 10¹ s.
- Reaches 100% at 10² s.
- **Trend**: Sharp, rapid ascent, achieving full verification by 10² s.
2. **BaB (Orange)**:
- Starts at 0% at 10⁰ s.
- Reaches 20% at 10¹ s.
- Jumps to 40% at 10² s.
- Reaches 100% at 10³ s.
- **Trend**: Gradual increase, slower than BaBSB.
3. **reluBaB (Green)**:
- Starts at 0% at 10⁰ s.
- Reaches 20% at 10¹ s.
- Jumps to 40% at 10² s.
- Reaches 100% at 10³ s.
- **Trend**: Similar to BaB but slightly faster in early stages.
4. **reluplex (Red)**:
- Starts at 0% at 10⁰ s.
- Reaches 20% at 10¹ s.
- Jumps to 40% at 10² s.
- Reaches 100% at 10³ s.
- **Trend**: Matches BaB and reluBaB in progression.
5. **MIPplanet (Purple)**:
- Starts at 0% at 10⁰ s.
- Reaches 20% at 10¹ s.
- Jumps to 40% at 10² s.
- Reaches 100% at 10³ s.
- **Trend**: Consistent with other methods but slower than BaBSB.
6. **planet (Brown)**:
- Starts at 0% at 10⁰ s.
- Reaches 20% at 10¹ s.
- Jumps to 40% at 10² s.
- Reaches 100% at 10³ s.
- **Trend**: Matches MIPplanet in progression.
7. **BlackBox (Pink)**:
- Starts at 0% at 10⁰ s.
- Reaches 20% at 10¹ s.
- Jumps to 40% at 10² s.
- Reaches 100% at 10³ s.
- **Trend**: Slowest method, matching others in later stages.
### Key Observations
- **BaBSB** is the fastest, achieving 100% verification by 10² s.
- **BlackBox** is the slowest, requiring 10³ s for full verification.
- All methods show stepwise increases, with no continuous curves.
- The logarithmic x-axis emphasizes exponential computation time growth, making early-time differences more pronounced.
### Interpretation
The chart demonstrates that **BaBSB** outperforms all other methods in terms of computational efficiency, achieving full property verification at the lowest computation time (10² s). In contrast, **BlackBox** is the least efficient, requiring 10³ s. The stepwise nature of the lines suggests discrete verification stages, with no method showing a smooth, continuous improvement. This implies that the methods are optimized for specific thresholds of computation time rather than gradual progress. The logarithmic scale highlights the exponential cost of computation, emphasizing the importance of early-time efficiency. BaBSB’s rapid ascent suggests it is the most scalable solution for property verification tasks.