## Heatmap: R1-Llama vs. R1-Qwen Performance
### Overview
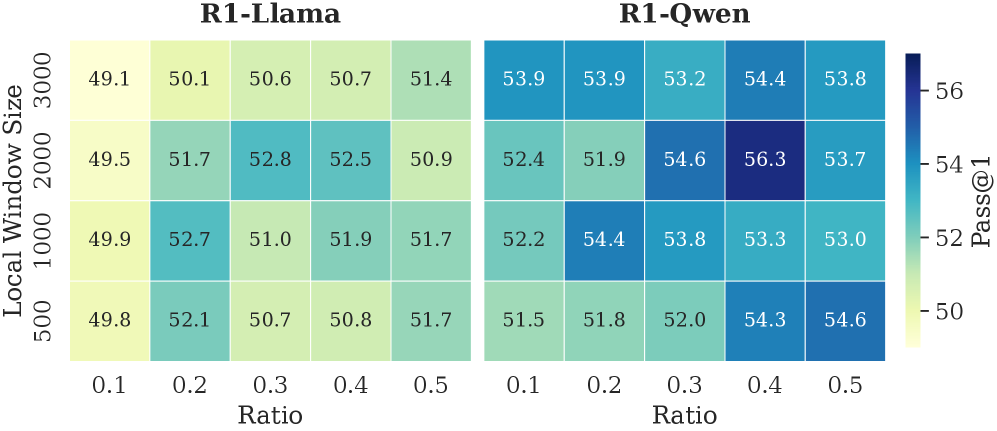
The image presents two heatmaps comparing the performance of "R1-Llama" and "R1-Qwen" models. The heatmaps visualize the "Pass@1" metric across different "Local Window Sizes" and "Ratio" values. The color intensity represents the Pass@1 score, with lighter shades indicating lower scores and darker shades indicating higher scores.
### Components/Axes
* **Titles:** "R1-Llama" (left heatmap), "R1-Qwen" (right heatmap)
* **Y-axis (Local Window Size):** 500, 1000, 2000, 3000
* **X-axis (Ratio):** 0.1, 0.2, 0.3, 0.4, 0.5
* **Color Legend (Pass@1):** Ranges from approximately 50 (lightest shade) to 56 (darkest shade). The legend shows a continuous color gradient.
### Detailed Analysis
**R1-Llama Heatmap:**
| Local Window Size | Ratio 0.1 | Ratio 0.2 | Ratio 0.3 | Ratio 0.4 | Ratio 0.5 |
| ----------------- | --------- | --------- | --------- | --------- | --------- |
| 3000 | 49.1 | 50.1 | 50.6 | 50.7 | 51.4 |
| 2000 | 49.5 | 51.7 | 52.8 | 52.5 | 50.9 |
| 1000 | 49.9 | 52.7 | 51.0 | 51.9 | 51.7 |
| 500 | 49.8 | 52.1 | 50.7 | 50.8 | 51.7 |
* **Trend:** The Pass@1 score for R1-Llama generally increases as the Ratio increases from 0.1 to 0.2. After 0.2, the performance fluctuates. The performance is generally lower for a Local Window Size of 3000.
**R1-Qwen Heatmap:**
| Local Window Size | Ratio 0.1 | Ratio 0.2 | Ratio 0.3 | Ratio 0.4 | Ratio 0.5 |
| ----------------- | --------- | --------- | --------- | --------- | --------- |
| 3000 | 53.9 | 53.9 | 53.2 | 54.4 | 53.8 |
| 2000 | 52.4 | 51.9 | 54.6 | 56.3 | 53.7 |
| 1000 | 52.2 | 54.4 | 53.8 | 53.3 | 53.0 |
| 500 | 51.5 | 51.8 | 52.0 | 54.3 | 54.6 |
* **Trend:** The Pass@1 score for R1-Qwen shows a more pronounced increase with higher Ratio values, particularly at a Local Window Size of 2000 and Ratio of 0.4, where the performance peaks.
### Key Observations
* R1-Qwen generally outperforms R1-Llama across most configurations.
* The highest Pass@1 score is achieved by R1-Qwen with a Local Window Size of 2000 and a Ratio of 0.4 (56.3).
* R1-Llama's performance seems less sensitive to changes in Ratio and Local Window Size compared to R1-Qwen.
### Interpretation
The heatmaps provide a visual comparison of the performance of two models, R1-Llama and R1-Qwen, under varying configurations of "Local Window Size" and "Ratio." The data suggests that R1-Qwen is a superior model, achieving higher Pass@1 scores across most parameter settings. The optimal configuration for R1-Qwen appears to be a Local Window Size of 2000 and a Ratio of 0.4, indicating that these settings are crucial for maximizing its performance. R1-Llama's relatively stable performance across different configurations might suggest a more robust but less optimized model. The choice of model and configuration should be guided by the specific application and the trade-off between performance and sensitivity to parameter tuning.