\n
## Bar Chart: Edit Distance vs. Noise Level
### Overview
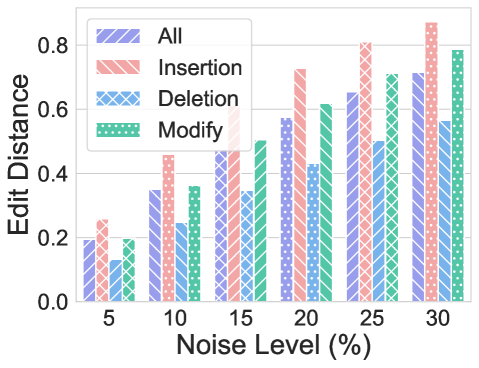
This bar chart visualizes the relationship between Edit Distance and Noise Level (%) for different types of edits: All, Insertion, Deletion, and Modify. The chart uses grouped bar representations to compare the edit distance for each edit type at various noise levels.
### Components/Axes
* **X-axis:** Noise Level (%), with markers at 5, 10, 15, 20, 25, and 30.
* **Y-axis:** Edit Distance, ranging from 0.0 to 0.8, with increments of 0.2.
* **Legend (Top-Right):**
* All (Light Blue, hatched pattern)
* Insertion (Light Red, solid pattern)
* Deletion (Light Blue, dotted pattern)
* Modify (Light Green, cross-hatched pattern)
### Detailed Analysis
The chart consists of six groups of bars, each corresponding to a specific Noise Level. Within each group, there are four bars representing the Edit Distance for All, Insertion, Deletion, and Modify edits.
* **Noise Level 5%:**
* All: Approximately 0.14
* Insertion: Approximately 0.24
* Deletion: Approximately 0.12
* Modify: Approximately 0.18
* **Noise Level 10%:**
* All: Approximately 0.36
* Insertion: Approximately 0.46
* Deletion: Approximately 0.26
* Modify: Approximately 0.32
* **Noise Level 15%:**
* All: Approximately 0.46
* Insertion: Approximately 0.54
* Deletion: Approximately 0.36
* Modify: Approximately 0.42
* **Noise Level 20%:**
* All: Approximately 0.56
* Insertion: Approximately 0.66
* Deletion: Approximately 0.44
* Modify: Approximately 0.52
* **Noise Level 25%:**
* All: Approximately 0.66
* Insertion: Approximately 0.76
* Deletion: Approximately 0.54
* Modify: Approximately 0.62
* **Noise Level 30%:**
* All: Approximately 0.72
* Insertion: Approximately 0.84
* Deletion: Approximately 0.60
* Modify: Approximately 0.70
**Trends:**
* **All:** The "All" edit distance generally increases with increasing noise level, showing an upward slope.
* **Insertion:** The "Insertion" edit distance exhibits the steepest upward slope, indicating that insertions are most affected by increasing noise.
* **Deletion:** The "Deletion" edit distance also increases with noise level, but at a slower rate than "Insertion".
* **Modify:** The "Modify" edit distance shows a similar trend to "Deletion", increasing with noise level but less steeply than "Insertion".
### Key Observations
* Insertion consistently has the highest edit distance across all noise levels.
* Deletion consistently has the lowest edit distance across all noise levels.
* The edit distance for all edit types increases as the noise level increases.
* The rate of increase in edit distance is most pronounced for insertions.
### Interpretation
The data suggests that the ability to accurately reconstruct data is significantly impacted by the level of noise present. Insertions are the most sensitive to noise, requiring the largest edit distance to correct, while deletions are the least sensitive. This could be due to the nature of the edits themselves – insertions introduce new information that is harder to verify in the presence of noise, while deletions simply remove existing information. The overall trend of increasing edit distance with noise level highlights the importance of noise reduction techniques in data processing and transmission. The chart demonstrates a clear correlation between noise and the difficulty of maintaining data integrity, as measured by edit distance. The consistent ranking of edit types (Insertion > All > Modify > Deletion) suggests inherent differences in their robustness to noise.