## Chart: Question vs. Thinking Importance Score
### Overview
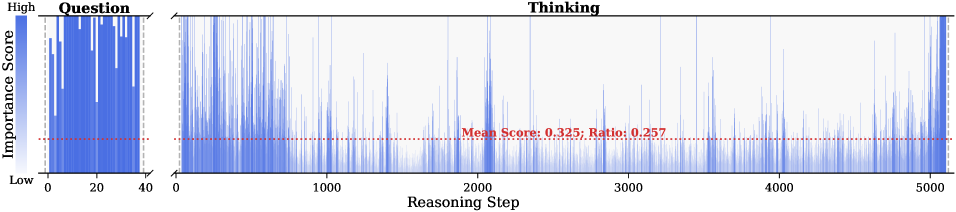
The image presents two bar charts showing the importance score for "Question" and "Thinking" across a series of reasoning steps. The "Question" chart displays the importance score for the initial question, while the "Thinking" chart shows the importance score for each reasoning step. A horizontal dotted line indicates the mean score and ratio for the "Thinking" chart.
### Components/Axes
* **Left Chart:**
* Title: "Question"
* Y-axis: "Importance Score" with a gradient from "Low" to "High"
* X-axis: Numerical values from 0 to 40, incrementing by 20.
* **Right Chart:**
* Title: "Thinking"
* X-axis: "Reasoning Step" with values from 0 to 5000, incrementing by 1000.
* Y-axis: Implied "Importance Score" (same as the left chart).
* **Horizontal Line (Thinking Chart):**
* Represents the mean score and ratio.
* Label: "Mean Score: 0.325; Ratio: 0.257"
### Detailed Analysis
* **Question Chart:**
* The bars are generally high, indicating a high importance score for the question.
* The importance score appears to fluctuate between approximately 0.6 and 1.0.
* **Thinking Chart:**
* The bars are generally lower than those in the "Question" chart, indicating a lower importance score for the reasoning steps.
* The importance score fluctuates significantly across the reasoning steps.
* The mean score is 0.325, and the ratio is 0.257, as indicated by the horizontal line.
* The importance score appears to increase towards the end of the reasoning steps (around 4000-5000).
### Key Observations
* The "Question" has a consistently high importance score.
* The "Thinking" process has a variable importance score, with a lower average compared to the "Question".
* There is a potential increase in importance score towards the end of the "Thinking" process.
### Interpretation
The data suggests that the initial question is considered highly important, while the individual reasoning steps vary in importance. The lower average importance score for the "Thinking" process could indicate that some reasoning steps are less relevant or contribute less to the overall solution. The increase in importance score towards the end of the "Thinking" process might suggest that the final reasoning steps are crucial for reaching a conclusion. The ratio of 0.257, in relation to the mean score of 0.325, could represent a measure of the variability or efficiency of the reasoning process. Further context is needed to fully understand the meaning of the ratio.