## Heatmap/Bar Chart: Importance Score Distribution Across Question and Thinking Phases
### Overview
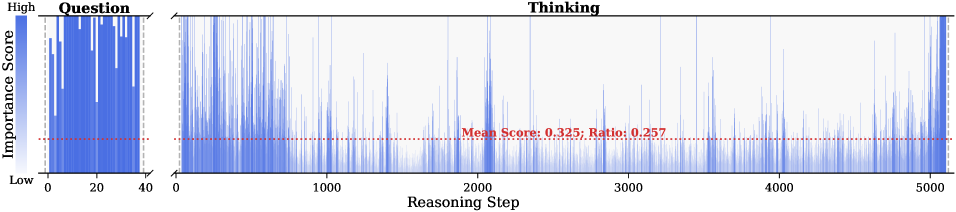
The image displays a two-part horizontal bar chart (or heatmap) visualizing the "Importance Score" of discrete steps within two distinct phases: "Question" and "Thinking." The chart compares the distribution and magnitude of importance scores across a short, dense sequence (Question) and a long, sparse sequence (Thinking).
### Components/Axes
* **Main Title/Phase Labels:** The chart is divided into two labeled sections:
* **Left Section:** Titled **"Question"**.
* **Right Section:** Titled **"Thinking"**.
* **Y-Axis (Vertical):**
* **Label:** "Importance Score".
* **Scale:** A continuous scale from **"Low"** at the bottom to **"High"** at the top. No numerical markers are provided on this axis.
* **X-Axis (Horizontal):**
* **Label (Shared):** "Reasoning Step".
* **"Question" Section Scale:** Linear scale from **0** to **40**.
* **"Thinking" Section Scale:** Linear scale from **0** to **5000**.
* **Data Representation:** Vertical blue bars. The height of each bar corresponds to the Importance Score for that specific Reasoning Step. The color intensity (shade of blue) appears consistent, with height being the primary variable.
* **Annotation:** A horizontal red dashed line runs across the entire chart at a constant y-value. Centered within the "Thinking" section, red text is overlaid on this line: **"Mean Score: 0.325; Ratio: 0.257"**.
### Detailed Analysis
**1. "Question" Phase (Steps 0-40):**
* **Spatial Grounding:** Occupies the left ~15% of the chart's width.
* **Trend & Data:** This section shows a very dense cluster of blue bars. The bars exhibit high variability in height, with many reaching near the top of the y-axis ("High" importance). The distribution appears relatively uniform across the 40 steps, with no clear increasing or decreasing trend. The density suggests every step in this short phase is assigned an importance score.
**2. "Thinking" Phase (Steps 0-5000):**
* **Spatial Grounding:** Occupies the right ~85% of the chart's width.
* **Trend & Data:** This section shows a much sparser distribution of blue bars. The bars are irregularly spaced, with large gaps of white space (indicating steps with a score of zero or near-zero). The heights of the visible bars are highly variable but generally appear lower on average than the peaks in the "Question" phase. There is no smooth trend; instead, there are sporadic spikes of higher importance scattered throughout the 5000 steps.
**3. Annotation Analysis:**
* The red dashed line and its associated text (**"Mean Score: 0.325; Ratio: 0.257"**) provide summary statistics.
* **Mean Score (0.325):** This likely represents the average Importance Score across *all* steps in both phases combined, or possibly just the "Thinking" phase. Given the visual density, it's more plausible as the mean for the "Thinking" phase.
* **Ratio (0.257):** This is ambiguous without a legend. It could represent:
* The ratio of the mean score to the maximum possible score.
* The proportion of steps with a non-zero importance score.
* The ratio of the "Thinking" phase mean to the "Question" phase mean.
### Key Observations
1. **Phase Contrast:** There is a stark contrast between the two phases. The "Question" phase is short (40 steps) but densely packed with high-importance signals. The "Thinking" phase is extremely long (5000 steps) but sparse, with importance signals appearing intermittently.
2. **Importance Concentration:** The highest density of high-importance scores is concentrated in the initial "Question" phase.
3. **Sparsity in Extended Reasoning:** The "Thinking" phase is characterized by sparsity, suggesting that most of the extended reasoning steps contribute minimally to the final output, with only specific steps being highly important.
4. **Quantitative Benchmark:** The annotation provides a quantitative benchmark (Mean: 0.325) against which individual step importance can be visually compared.
### Interpretation
This chart likely visualizes the internal attention or importance weighting of an AI model during a complex reasoning task. The **"Question"** phase represents the model's processing of the initial prompt or query. The high, dense importance scores here indicate that the model correctly identifies and heavily weights the core components of the input question.
The **"Thinking"** phase represents the model's internal chain-of-thought or reasoning process. The sparsity and lower average importance suggest that while the model generates a very long sequence of internal steps, only a small fraction of these steps are critical for arriving at the solution. The scattered high-importance spikes may correspond to key logical deductions, intermediate conclusions, or moments of "insight" within the reasoning chain.
The **Mean Score (0.325)** and **Ratio (0.257)** serve as diagnostic metrics. A low mean score in the thinking phase might indicate inefficient or meandering reasoning. The ratio could be a measure of reasoning efficiency—how concentrated the important steps are. This visualization is crucial for understanding model behavior, diagnosing inefficiencies in long-form reasoning, and potentially guiding techniques to make the thinking process more focused and effective.