\n
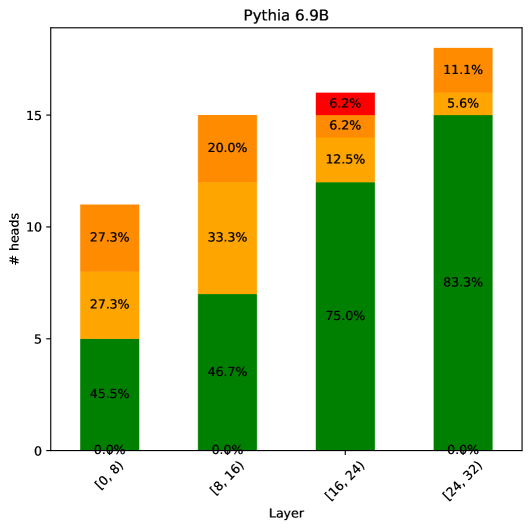
## Stacked Bar Chart: Pythia 6.9B Attention Head Distribution by Layer
### Overview
This is a stacked bar chart visualizing the distribution of different types of attention heads across the layers of the Pythia 6.9B language model. The chart shows four bars, each representing a range of model layers, with the total height of each bar indicating the total number of attention heads in that layer range. Each bar is segmented by color, representing the proportion of heads belonging to different categories.
### Components/Axes
* **Chart Title:** "Pythia 6.9B" (Top center)
* **X-Axis:**
* **Label:** "Layer" (Bottom center)
* **Categories (from left to right):**
1. `[0, 8)`
2. `[8, 16)`
3. `[16, 24)`
4. `[24, 32)`
* **Y-Axis:**
* **Label:** "# heads" (Left side, rotated vertically)
* **Scale:** Linear, from 0 to 15, with major ticks at 0, 5, 10, 15.
* **Data Series (Inferred from color and position):** The legend is not explicitly shown, but the consistent color coding across bars implies four categories. From bottom to top within each bar:
1. **Green (Bottom segment)**
2. **Orange (Middle segment)**
3. **Yellow (Upper-middle segment)**
4. **Red (Top segment, only present in one bar)**
### Detailed Analysis
**Bar 1: Layers [0, 8)**
* **Total Height (Approximate):** 11 heads
* **Segment Breakdown (from bottom to top):**
* **Green:** 45.5% (≈5 heads)
* **Orange:** 27.3% (≈3 heads)
* **Yellow:** 27.3% (≈3 heads)
* **Red:** 0.0% (0 heads)
**Bar 2: Layers [8, 16)**
* **Total Height (Approximate):** 15 heads
* **Segment Breakdown (from bottom to top):**
* **Green:** 46.7% (≈7 heads)
* **Orange:** 33.3% (≈5 heads)
* **Yellow:** 20.0% (≈3 heads)
* **Red:** 0.0% (0 heads)
**Bar 3: Layers [16, 24)**
* **Total Height (Approximate):** 16 heads
* **Segment Breakdown (from bottom to top):**
* **Green:** 75.0% (≈12 heads)
* **Orange:** 12.5% (≈2 heads)
* **Yellow:** 6.2% (≈1 head)
* **Red:** 6.2% (≈1 head)
**Bar 4: Layers [24, 32)**
* **Total Height (Approximate):** 18 heads
* **Segment Breakdown (from bottom to top):**
* **Green:** 83.3% (≈15 heads)
* **Orange:** 5.6% (≈1 head)
* **Yellow:** 11.1% (≈2 heads)
* **Red:** 0.0% (0 heads)
### Key Observations
1. **Increasing Total Heads:** The total number of attention heads per layer range increases from the first to the last bar (≈11 → 15 → 16 → 18).
2. **Dominant Green Segment:** The proportion of "Green" category heads increases dramatically across layers, from 45.5% in the first layers to 83.3% in the final layers. It becomes the overwhelming majority in the second half of the model.
3. **Declining Orange Segment:** The "Orange" category shows a clear downward trend, decreasing from 27.3% to 5.6%.
4. **Anomaly in Third Bar:** The `[16, 24)` layer range is the only one containing a "Red" category segment (6.2%). It also has the smallest "Yellow" segment (6.2%).
5. **Yellow Segment Fluctuation:** The "Yellow" category does not follow a monotonic trend, starting at 27.3%, dipping to 6.2% in the third bar, and rising slightly to 11.1% in the final bar.
### Interpretation
This chart likely illustrates the functional specialization of attention heads within the Pythia 6.9B model. The "Green" heads, which dominate the later layers, are probably responsible for higher-level, task-specific, or output-oriented processing. The "Orange" heads, prominent in early layers, may handle more fundamental syntactic or local contextual tasks. The unique appearance of a "Red" head in the middle layers (`[16, 24)`) suggests a specialized function that is only activated or necessary in that specific processing stage. The overall increase in total heads per layer range indicates that the model allocates more computational resources (attention mechanisms) to deeper processing stages. The distribution pattern suggests a shift from diverse, possibly general-purpose head types in early layers to a more homogeneous, specialized set of heads in later layers.