TECHNICAL ASSET FINGERPRINT
14f0e9002194650c2d2386b2
Click to view fullscreen
Press ESC or click to close
FOUND IN PAPERS
EXPERT: healer-alpha-free VERSION 1
RUNTIME: free/openrouter/healer-alpha
INTEL_VERIFIED
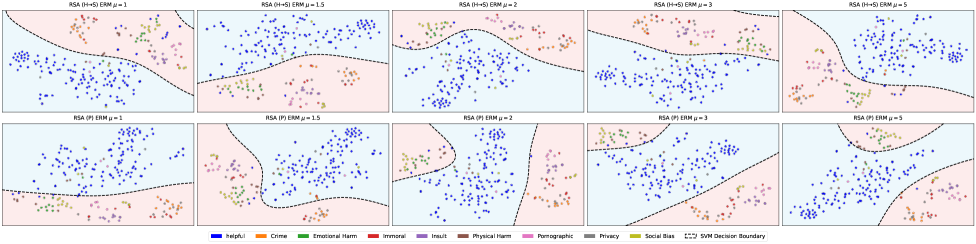
## Scatter Plot Grid with SVM Decision Boundaries: RSA (H=0) and RSA (F) with Varying μ
### Overview
The image displays a 2x5 grid of scatter plots, each visualizing the classification performance of a machine learning model (likely using Empirical Risk Minimization - ERM) on a dataset with multiple classes. The plots compare two different RSA (Representational Similarity Analysis) conditions across five different values of a parameter μ (mu). Each plot shows data points colored by their true class label, overlaid with a dashed line representing the SVM decision boundary and background shading indicating the predicted class regions (light blue and light pink).
### Components/Axes
* **Grid Structure:** 2 rows, 5 columns.
* **Row Titles (Top Row):** `RSA (H=0) ERM μ=1`, `RSA (H=0) ERM μ=1.5`, `RSA (H=0) ERM μ=2`, `RSA (H=0) ERM μ=3`, `RSA (H=0) ERM μ=5`.
* **Row Titles (Bottom Row):** `RSA (F) ERM μ=1`, `RSA (F) ERM μ=1.5`, `RSA (F) ERM μ=2`, `RSA (F) ERM μ=3`, `RSA (F) ERM μ=5`.
* **Legend (Bottom Center):** A horizontal legend maps colors to 10 class labels:
* Blue: `Helpful`
* Orange: `Crime`
* Green: `Emotional Harm`
* Red: `Immoral`
* Purple: `Insult`
* Brown: `Physical Harm`
* Pink: `Pornographic`
* Gray: `Privacy`
* Olive Green: `Social Bias`
* Dashed Line: `SVM Decision Boundary`
* **Plot Axes:** The axes are not labeled with numerical values or titles. The plots appear to be in a 2D feature space.
* **Plot Background:** Each subplot has a two-tone background (light blue and light pink) separated by the SVM decision boundary, indicating the model's predicted class regions.
### Detailed Analysis
**Row 1: RSA (H=0) ERM**
* **μ=1:** The decision boundary is a relatively smooth, slightly wavy horizontal line. The `Helpful` (blue) class is predominantly clustered in the lower blue region. Other classes (e.g., `Crime`, `Emotional Harm`, `Immoral`) are scattered in the upper pink region, with some mixing near the boundary.
* **μ=1.5:** The boundary becomes more complex, with a pronounced downward curve on the left side. The separation of the `Helpful` class remains strong in the lower region.
* **μ=2:** The boundary develops a significant upward bulge in the center-left. The clustering of non-`Helpful` classes in the upper region appears slightly more dispersed.
* **μ=3:** The boundary simplifies again, resembling a gentler version of the μ=1.5 curve. Class separation appears visually similar.
* **μ=5:** The boundary is a smooth, concave curve (like a shallow "U"). The `Helpful` class is tightly clustered in the lower central blue region, while other classes are spread across the upper pink region.
**Row 2: RSA (F) ERM**
* **μ=1:** The boundary is a complex, multi-curved line. The `Helpful` class is not as cleanly separated; many blue points are found in the upper pink region, especially on the left.
* **μ=1.5:** The boundary forms a large, smooth loop or peninsula shape. There is significant mixing of classes, with many non-`Helpful` points inside the blue region and `Helpful` points in the pink region.
* **μ=2:** The boundary is highly complex and fragmented, creating multiple isolated blue and pink regions. This suggests severe overfitting or a highly non-linear separation attempt. Class mixing is extensive.
* **μ=3:** The boundary simplifies to a single, wavy line. Class separation is poor, with a high degree of intermingling across the entire plot.
* **μ=5:** The boundary is a smooth, convex curve (like an inverted "U"). The `Helpful` class is somewhat concentrated in the upper blue region, but there is still considerable overlap with other classes in the lower pink region.
### Key Observations
1. **Parameter Sensitivity:** The shape of the SVM decision boundary is highly sensitive to the value of μ, especially in the RSA (F) condition.
2. **Condition Contrast:** The RSA (H=0) condition (top row) generally produces simpler, more stable boundaries that achieve better visual separation of the `Helpful` class (blue) from the others. The RSA (F) condition (bottom row) results in more complex, erratic boundaries and poorer class separation.
3. **Class Imbalance/Dominance:** The `Helpful` class (blue) appears to be the most numerous and forms a distinct cluster in most plots, particularly in the RSA (H=0) condition. The other nine classes are often intermixed.
4. **Overfitting Indicator:** The plot for `RSA (F) ERM μ=2` is a clear outlier, showing a highly fragmented boundary indicative of potential overfitting to the training data.
5. **Boundary Evolution:** In RSA (H=0), increasing μ from 1 to 5 seems to transition the boundary from a wavy line to a more pronounced curve. In RSA (F), the relationship is non-monotonic, with complexity peaking at μ=2.
### Interpretation
This visualization likely comes from a study on model robustness, fairness, or representation learning, comparing two different representational constraints (H=0 vs. F) under ERM. The parameter μ probably controls a regularization strength or a margin parameter in the SVM.
* **What the data suggests:** The RSA (H=0) constraint leads to more generalizable and simpler decision boundaries that effectively isolate the `Helpful` class. In contrast, the RSA (F) constraint results in unstable, complex boundaries that fail to generalize well, as evidenced by the severe overfitting at μ=2 and poor separation at other values.
* **Relationship between elements:** The background color (blue/pink) represents the model's prediction for that region of feature space. The dashed line is the threshold where the model's prediction flips. The colored dots show the ground truth. A good model would have all blue dots in the blue region and all other dots in the pink region. The plots show varying degrees of success in achieving this.
* **Notable anomalies:** The `RSA (F) ERM μ=2` plot is a critical anomaly. Its fragmented boundary suggests the optimization process found a solution that fits noise or specific quirks of the data rather than learning a robust pattern. This highlights a potential failure mode or instability introduced by the RSA (F) condition at that specific parameter setting.
* **Underlying message:** The comparison argues for the superiority or stability of the RSA (H=0) approach over RSA (F) for this specific classification task under ERM, as it produces more interpretable and consistent decision boundaries across a range of μ values. The `Helpful` class is the primary focus of separation, while the other "harmful" or "negative" classes are treated as a collective group by the classifier.
DECODING INTELLIGENCE...