## Line Chart: SER vs. Pilot Size
### Overview
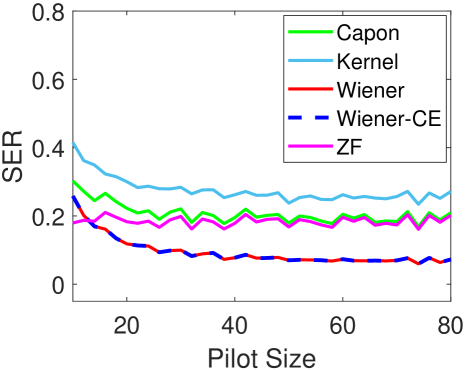
The image is a line chart comparing the Symbol Error Rate (SER) of five different algorithms (Capon, Kernel, Wiener, Wiener-CE, and ZF) as a function of Pilot Size. The x-axis represents the Pilot Size, ranging from approximately 0 to 80. The y-axis represents the SER, ranging from 0 to 0.8.
### Components/Axes
* **X-axis:** Pilot Size, ranging from 0 to 80 in increments of 20.
* **Y-axis:** SER (Symbol Error Rate), ranging from 0 to 0.8 in increments of 0.2.
* **Legend (top-right):**
* Green: Capon
* Light Blue: Kernel
* Red: Wiener
* Blue dashed: Wiener-CE
* Magenta: ZF
### Detailed Analysis
* **Capon (Green):** The SER starts at approximately 0.3 at a Pilot Size of 5, decreases slightly, and then remains relatively constant around 0.2 for Pilot Sizes greater than 20.
* **Kernel (Light Blue):** The SER starts at approximately 0.4 at a Pilot Size of 5, decreases slightly, and then remains relatively constant around 0.3 for Pilot Sizes greater than 20.
* **Wiener (Red):** The SER starts at approximately 0.22 at a Pilot Size of 5, decreases rapidly, and then remains relatively constant around 0.08 for Pilot Sizes greater than 20.
* **Wiener-CE (Blue dashed):** The SER starts at approximately 0.25 at a Pilot Size of 5, decreases rapidly, and then remains relatively constant around 0.08 for Pilot Sizes greater than 20.
* **ZF (Magenta):** The SER starts at approximately 0.28 at a Pilot Size of 5, decreases slightly, and then remains relatively constant around 0.2 for Pilot Sizes greater than 20.
### Key Observations
* The Wiener and Wiener-CE algorithms have the lowest SER across all Pilot Sizes greater than 20.
* The Kernel algorithm has the highest SER across all Pilot Sizes greater than 20.
* All algorithms show a decrease in SER as the Pilot Size increases from 0 to 20.
* Beyond a Pilot Size of 20, the SER for all algorithms remains relatively constant.
### Interpretation
The chart demonstrates the relationship between Pilot Size and Symbol Error Rate for different algorithms. The data suggests that increasing the Pilot Size initially reduces the SER for all algorithms. However, beyond a certain Pilot Size (approximately 20), the SER plateaus, indicating that further increases in Pilot Size do not significantly improve performance. The Wiener and Wiener-CE algorithms consistently outperform the other algorithms in terms of SER, suggesting they are more robust to noise or interference. The Kernel algorithm performs the worst.