# Technical Document Extraction: SER vs. Pilot Size Performance Chart
## 1. Component Isolation
* **Header:** None present.
* **Main Chart Area:** A 2D line graph plotting Symbol Error Rate (SER) against Pilot Size.
* **Legend:** Located in the upper-right quadrant of the plot area.
* **Axes:** Y-axis (Vertical) representing SER; X-axis (Horizontal) representing Pilot Size.
---
## 2. Metadata and Axis Extraction
* **Y-Axis Label:** `SER` (Symbol Error Rate)
* **Y-Axis Scale:** Linear, ranging from `0` to `0.8`.
* **Y-Axis Markers:** `0`, `0.2`, `0.4`, `0.6`, `0.8`.
* **X-Axis Label:** `Pilot Size`
* **X-Axis Scale:** Linear, ranging from approximately `8` to `80`.
* **X-Axis Markers:** `20`, `40`, `60`, `80`.
---
## 3. Legend and Series Identification
The legend is located at approximately `[x=0.65, y=0.15]` relative to the top-left corner of the image frame.
| Legend Label | Line Color | Line Style | Visual Trend Description |
| :--- | :--- | :--- | :--- |
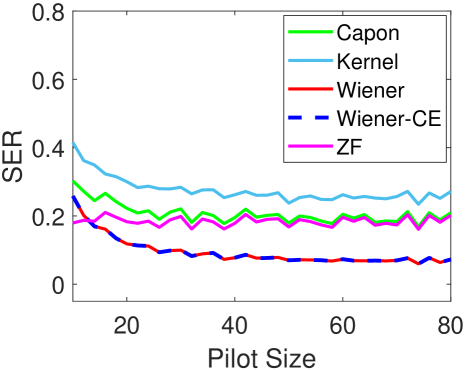
| **Capon** | Green | Solid | Starts at ~0.3, drops quickly, then fluctuates between 0.18 and 0.22. |
| **Kernel** | Light Blue | Solid | Highest error rate; starts at ~0.42, stabilizes around 0.25–0.28. |
| **Wiener** | Red | Solid | Starts at ~0.25, drops sharply, stabilizes at the lowest level (~0.08). |
| **Wiener-CE** | Blue | Dashed | Overlays the "Wiener" line almost perfectly; follows the same downward trend to ~0.08. |
| **ZF** | Magenta | Solid | Starts lowest (~0.18), remains relatively flat with minor fluctuations around 0.18–0.20. |
---
## 4. Data Analysis and Key Trends
### General Observations
All methods show an initial improvement (decrease in SER) as the Pilot Size increases from the starting point to approximately 20. Beyond a Pilot Size of 30, the performance for all methods reaches a "steady state" where the SER fluctuates within a narrow band but does not significantly decrease further.
### Comparative Performance
1. **Best Performers (Lowest SER):** The **Wiener** and **Wiener-CE** methods are the most effective. They converge to an SER of approximately **0.08**. The dashed blue line (Wiener-CE) and solid red line (Wiener) are visually indistinguishable for most of the plot, indicating identical or near-identical performance.
2. **Mid-Tier Performers:**
* **ZF (Zero Forcing):** Maintains a consistent SER around **0.18–0.20**. Interestingly, it starts with the lowest error at the smallest pilot size but is overtaken by the Wiener methods as pilot size increases.
* **Capon:** Performs slightly worse than ZF, stabilizing around an SER of **0.20–0.22**.
3. **Worst Performer (Highest SER):** The **Kernel** method consistently exhibits the highest Symbol Error Rate, stabilizing at approximately **0.26**.
---
## 5. Estimated Data Points (Sampling)
| Pilot Size (Approx) | Kernel (Blue) | Capon (Green) | ZF (Magenta) | Wiener/Wiener-CE (Red/Blue Dash) |
| :--- | :--- | :--- | :--- | :--- |
| **10** | 0.38 | 0.28 | 0.18 | 0.22 |
| **20** | 0.30 | 0.22 | 0.18 | 0.12 |
| **40** | 0.26 | 0.20 | 0.18 | 0.08 |
| **60** | 0.26 | 0.20 | 0.19 | 0.07 |
| **80** | 0.27 | 0.21 | 0.20 | 0.08 |
---
## 6. Language Declaration
The text in this image is entirely in **English**. No other languages were detected.