## Diagram: Octree Spatial Data Structure with Linked Point Chunks
### Overview
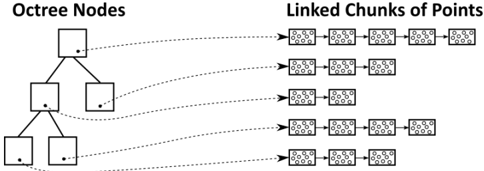
The image is a black-and-white technical diagram illustrating the relationship between an **Octree** data structure and its associated **Linked Chunks of Points**. It visually explains how spatial data (points) are hierarchically organized and stored. The diagram is divided into two primary sections connected by dashed arrows.
### Components/Axes
1. **Left Section: "Octree Nodes"**
* **Title:** "Octree Nodes" (top-left).
* **Structure:** A hierarchical tree diagram.
* A single **root node** at the top.
* The root node branches into **two child nodes** at the second level.
* Each of these two child nodes branches further into **two child nodes** at the third level, resulting in **four leaf nodes**.
* **Node Representation:** Each node is a square containing a single black dot, likely representing a spatial region or a data point within that region.
2. **Right Section: "Linked Chunks of Points"**
* **Title:** "Linked Chunks of Points" (top-right).
* **Structure:** Multiple horizontal chains of rectangular blocks.
* **Chunk Representation:** Each rectangular block ("chunk") contains a pattern of small dots, representing a collection or cluster of data points.
* **Linking:** The chunks within each chain are connected by short horizontal lines, indicating a linked list or sequential data structure.
3. **Connections (Dashed Arrows):**
* Dashed arrows originate from the black dot inside each octree node and point to the **first chunk** in a corresponding chain on the right.
* This establishes a direct, one-to-one relationship between a spatial node in the octree and the head of a linked list of point data chunks.
### Detailed Analysis
* **Spatial Hierarchy:** The octree demonstrates a classic 2D spatial subdivision (a quadtree, though labeled "Octree," which is typically 3D). The root represents the entire space, which is recursively subdivided.
* **Data Linkage Mapping:**
* The **Root Node** (top) is linked to a chain of **5 point chunks**.
* The **Left Child Node** (middle level) is linked to a chain of **3 point chunks**.
* The **Right Child Node** (middle level) is linked to a chain of **2 point chunks**.
* The **Four Leaf Nodes** (bottom level) are each linked to a chain of **4 point chunks**.
* **Data Distribution:** The number of point chunks linked to each node varies (5, 3, 2, 4, 4, 4, 4), suggesting that the density or amount of point data is not uniform across the different spatial regions represented by the nodes.
### Key Observations
1. **One-to-Many Relationship:** Each octree node, regardless of its level in the hierarchy, points to the start of a *list* of data chunks, not just a single data point. This indicates a design for handling variable data density per spatial region.
2. **Consistent Leaf Node Data:** All four leaf nodes at the bottom of the hierarchy are linked to chains of identical length (4 chunks each). This could imply a uniform data distribution at the finest level of spatial subdivision or a design choice to cap chunk list length at leaves.
3. **Non-Uniform Higher-Level Data:** The root and intermediate nodes have varying numbers of linked chunks (5, 3, 2), reflecting the aggregated or summarized data content of their respective, larger spatial regions.
4. **Visual Encoding:** The diagram uses simple, clear visual metaphors: squares for spatial containers, dots for points/centers, and linked rectangles for data lists. The dashed arrows explicitly map the abstract tree structure to the concrete data storage layout.
### Interpretation
This diagram explains a common optimization technique in computer graphics, computational geometry, or spatial databases. The **octree** provides a hierarchical spatial index, allowing for efficient queries (e.g., "find all points near this location") by quickly narrowing down relevant regions. The **linked chunks of points** represent the actual point cloud data, stored in manageable, sequential blocks.
The key insight is the **decoupling of the spatial index (tree) from the raw data storage (linked lists)**. This architecture allows:
* **Efficient Traversal:** The tree enables fast spatial searches.
* **Flexible Data Storage:** The linked chunk lists can grow or be managed independently of the tree structure. A node can point to a long list if its region is dense with points, or a short list if it's sparse.
* **Memory Locality:** Storing points in chunks (rather than individually) can improve cache performance during processing.
The variation in chunk list lengths visually argues that real-world spatial data is rarely uniform, and this data structure is designed to handle that irregularity efficiently. The diagram serves as a blueprint for implementing a system that balances fast spatial access with practical data management.