## [Line Charts with Confidence Intervals]: Comparative Performance of Gemma Model Variants
### Overview
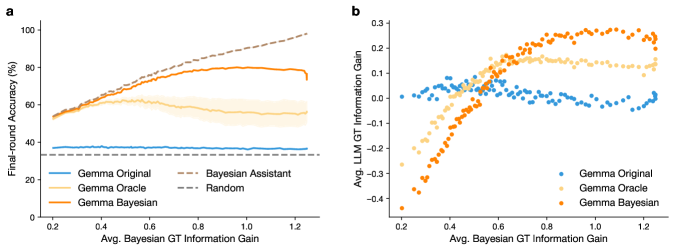
The image contains two side-by-side line charts (labeled **a** and **b**) that plot the performance of different versions of a "Gemma" model against a common x-axis metric. Both charts include shaded regions representing confidence intervals or variance around the mean trend lines. The charts compare a baseline model ("Gemma Original"), an idealized version ("Gemma Oracle"), and a Bayesian variant ("Gemma Bayesian"). Chart **a** also includes two reference baselines: "Bayesian Assistant" and "Random."
### Components/Axes
**Common X-Axis (Both Charts):**
* **Label:** `Avg. Bayesian GT Information Gain`
* **Scale:** Linear, ranging from 0.2 to 1.2, with major ticks at 0.2, 0.4, 0.6, 0.8, 1.0, and 1.2.
**Chart a (Left):**
* **Y-Axis Label:** `Final-round Accuracy (%)`
* **Scale:** Linear, ranging from 0 to 100, with major ticks at 0, 20, 40, 60, 80, and 100.
* **Legend (Bottom-Left Corner):**
* `Gemma Original` (Solid blue line)
* `Gemma Oracle` (Solid light orange line)
* `Gemma Bayesian` (Solid orange line)
* `Bayesian Assistant` (Dashed brown line)
* `Random` (Dashed gray line)
**Chart b (Right):**
* **Y-Axis Label:** `Avg. LLM GT Information Gain`
* **Scale:** Linear, ranging from -0.4 to 0.3, with major ticks at -0.4, -0.3, -0.2, -0.1, 0.0, 0.1, 0.2, and 0.3.
* **Legend (Bottom-Right Corner):**
* `Gemma Original` (Blue dots)
* `Gemma Oracle` (Light orange dots)
* `Gemma Bayesian` (Orange dots)
### Detailed Analysis
**Chart a: Final-round Accuracy vs. Information Gain**
* **Trend Verification & Data Points (Approximate):**
1. **Gemma Original (Blue):** A flat, horizontal line. Accuracy remains constant at approximately **35%** across the entire x-axis range (0.2 to 1.2).
2. **Random (Gray Dashed):** A flat, horizontal line, nearly identical to Gemma Original, at approximately **35%**.
3. **Gemma Oracle (Light Orange):** Starts at ~55% accuracy at x=0.2. It rises to a peak of approximately **60%** around x=0.6, then gradually declines to about **55%** by x=1.2. The shaded confidence band is widest around the peak.
4. **Gemma Bayesian (Orange):** Starts at ~55% at x=0.2. It shows a steady, monotonic increase, reaching approximately **80%** accuracy by x=1.2. The trend is clearly upward-sloping.
5. **Bayesian Assistant (Brown Dashed):** Starts at ~55% at x=0.2. It exhibits the steepest and most consistent upward trend, reaching nearly **100%** accuracy by x=1.2.
**Chart b: LLM GT Information Gain vs. Bayesian GT Information Gain**
* **Trend Verification & Data Points (Approximate):**
1. **Gemma Original (Blue Dots):** The data points are scattered around the **y=0** line across the entire x-axis range. There is no clear upward or downward trend; the values fluctuate roughly between -0.05 and +0.05.
2. **Gemma Oracle (Light Orange Dots):** Starts with negative values (~ -0.3 at x=0.2). It increases sharply, crossing into positive territory around x=0.45, peaks at approximately **+0.15** near x=0.7, and then shows a slight decline to about **+0.12** by x=1.2.
3. **Gemma Bayesian (Orange Dots):** Starts with the most negative values (~ -0.4 at x=0.2). It shows a strong, consistent upward trend, crossing zero around x=0.5, and continues to rise, reaching approximately **+0.25** by x=1.2. This series shows the highest final values.
### Key Observations
1. **Performance Hierarchy:** In both metrics (Accuracy and Information Gain), the `Gemma Bayesian` model significantly outperforms the `Gemma Original` baseline and generally outperforms the `Gemma Oracle` at higher levels of Bayesian GT Information Gain (x > ~0.6).
2. **Baseline Comparison:** The `Gemma Original` model performs identically to the `Random` baseline in final accuracy (Chart a) and shows no net information gain (Chart b), suggesting it is not effectively utilizing the provided information.
3. **Oracle Limitation:** The `Gemma Oracle` model shows an initial performance boost but its gains plateau and even slightly decline at higher x-values, indicating a potential ceiling or overfitting effect.
4. **Strongest Performer:** The `Bayesian Assistant` (in Chart a) demonstrates the most robust and scalable performance, achieving near-perfect accuracy as the information gain metric increases.
5. **Correlation:** There is a clear positive correlation between the x-axis metric (`Avg. Bayesian GT Information Gain`) and the performance of the Bayesian-informed models (`Gemma Bayesian`, `Bayesian Assistant`) on both y-axis metrics.
### Interpretation
The data suggests that incorporating Bayesian methods (`Gemma Bayesian`, `Bayesian Assistant`) allows the model to effectively translate increased "Bayesian GT Information Gain" into both higher final accuracy and higher own information gain (LLM GT). This indicates successful learning and utilization of the provided ground truth information.
The `Gemma Original` model's flatline performance implies it is not learning from the information signal, acting as a static baseline. The `Gemma Oracle` model's curve—rising then falling—might represent a model that can leverage information up to a point but then becomes miscalibrated or overconfident when the information gain becomes very high.
The stark contrast between the ascending `Gemma Bayesian` line and the flat `Gemma Original`/`Random` lines in Chart **a** provides strong visual evidence for the efficacy of the Bayesian approach in this context. Chart **b** reinforces this by showing that the Bayesian model not only becomes more accurate but also becomes better at generating information itself as it receives more informative ground truth. The `Bayesian Assistant` likely represents an upper-bound or idealized agent, showing the potential ceiling of performance if the Bayesian integration is optimized.