## Scatter Plots: Populations in LLM-based AHD
### Overview
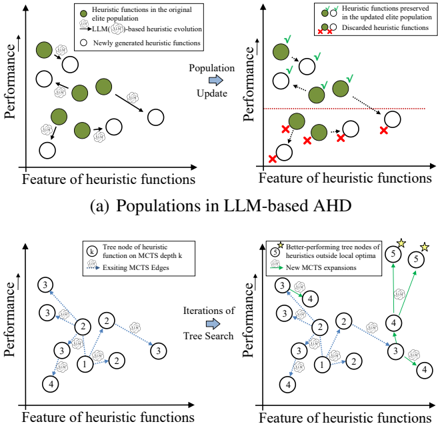
The image presents four scatter plots, labeled (a) through (d), illustrating the relationship between "Performance" and "Feature of heuristic functions". The plots visualize populations of heuristic functions during an LLM-based Automated Heuristic Design (AHD) process. Each plot uses different symbols to represent different types of heuristic functions and their evolution.
### Components/Axes
* **X-axis:** "Feature of heuristic functions" (appears on all four plots). The scale is not explicitly defined, but represents a continuous variable.
* **Y-axis:** "Performance" (appears on all four plots). The scale is not explicitly defined, but represents a continuous variable.
* **Plot (a) Legend:**
* Dark Green Circles: "Heuristic functions in the original elite population"
* Light Gray Circles: "LLM-based heuristic evolution"
* White Circles: "Newly generated heuristic functions"
* **Plot (b) Legend:**
* Dark Green Circles: "Heuristic functions preserved in the updated elite population"
* Red Crosses: "Discarded heuristic functions"
* Light Green Triangles: "Newly generated heuristic functions"
* **Plot (c) Legend:**
* Light Blue Circles: "Tree node of heuristic function on MCTS depth k"
* Light Blue Diamonds: "Existing MCTS edges"
* **Plot (d) Legend:**
* Light Blue Circles: "Better-performing tree nodes of heuristics outside local optima"
* Yellow Stars: "New MCTS expansions"
* Light Blue Diamonds: "Existing MCTS edges"
* **Title:** "(a) Populations in LLM-based AHD" (for the first plot)
### Detailed Analysis or Content Details
**Plot (a):**
The plot shows a general downward trend. The dark green circles (original elite population) are scattered across the plot, with a concentration towards the upper-left. The light gray circles (LLM evolution) are more dispersed, and the white circles (newly generated) are mostly located towards the lower-left.
* Approximate data points (estimated from visual inspection):
* Dark Green: (0.2, 8), (0.3, 7), (0.4, 6), (0.5, 5), (0.6, 4), (0.7, 3), (0.8, 2)
* Light Gray: (0.1, 5), (0.2, 4), (0.3, 3), (0.4, 2), (0.5, 1)
* White: (0.1, 2), (0.2, 1), (0.3, 0.5)
**Plot (b):**
This plot shows a mix of preserved and discarded heuristic functions. The dark green circles (preserved) are concentrated in the upper-right, while the red crosses (discarded) are scattered towards the lower-left. The light green triangles (newly generated) are dispersed.
* Approximate data points:
* Dark Green: (0.3, 7), (0.4, 6), (0.5, 5), (0.6, 4), (0.7, 3)
* Red Cross: (0.1, 2), (0.2, 1), (0.3, 0.5), (0.4, 0.2)
* Light Green: (0.2, 3), (0.3, 2), (0.4, 1)
**Plot (c):**
This plot displays a network-like structure with nodes (light blue circles) connected by edges (light blue diamonds). The plot shows a downward trend in performance as the iterations of the tree search increase. The nodes are numbered 1 through 5.
* Approximate data points:
* Node 1: (0.2, 7)
* Node 2: (0.4, 6)
* Node 3: (0.6, 5)
* Node 4: (0.8, 4)
* Node 5: (1.0, 3)
**Plot (d):**
Similar to plot (c), this plot shows a network structure with nodes and edges. It also exhibits a downward trend in performance with increasing tree search iterations. A yellow star indicates a new MCTS expansion.
* Approximate data points:
* Node 1: (0.2, 6)
* Node 2: (0.4, 5)
* Node 3: (0.6, 4)
* Node 4: (0.8, 3)
* Node 5: (1.0, 2)
* Yellow Star: (0.5, 4.5)
### Key Observations
* In plots (a) and (b), the LLM-based evolution and newly generated functions tend to have lower performance than the original elite population.
* Plots (c) and (d) demonstrate a clear trade-off between exploration (MCTS expansions) and exploitation (existing edges) in the tree search process.
* The network structures in plots (c) and (d) suggest a hierarchical relationship between heuristic functions.
### Interpretation
These plots illustrate the dynamics of heuristic function populations during an LLM-based AHD process. Plot (a) shows the initial population and the introduction of new heuristics through LLM evolution. Plot (b) demonstrates the selection process, where better-performing heuristics are preserved, and less effective ones are discarded. Plots (c) and (d) provide insights into the tree search process, showing how the algorithm explores different heuristic functions and refines its search strategy. The downward trends in performance in plots (c) and (d) likely represent the algorithm converging towards a local optimum. The yellow star in plot (d) indicates an attempt to escape this local optimum by expanding the search space. The overall data suggests that the LLM-based AHD process is effective in generating and evaluating heuristic functions, but it may require further refinement to avoid getting stuck in local optima. The use of MCTS and the visualization of the tree structure provide a valuable tool for understanding the algorithm's behavior and identifying areas for improvement.