## Diagram: Hypothesis Generation
### Overview
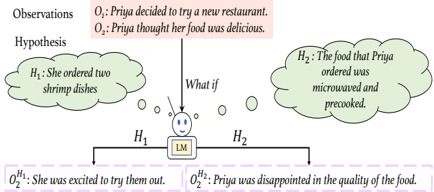
The image illustrates a hypothesis generation process based on observations and a language model (LM). It shows how different hypotheses can lead to different subsequent observations.
### Components/Axes
* **Observations:**
* O₁: Priya decided to try a new restaurant. (Top-right, in a light red box)
* O₂: Priya thought her food was delicious. (Top-right, in a light red box)
* **Hypothesis:**
* H₁: She ordered two shrimp dishes (Left, in a green cloud shape)
* H₂: The food that Priya ordered was microwaved and precooked. (Right, in a green cloud shape)
* **Language Model (LM):** Represented by a smiling face with "LM" written on a box below it (Center).
* **What if:** Text above the LM, indicating the LM is considering different possibilities.
* **Resulting Observations:**
* O₂<sup>H₁</sup>: She was excited to try them out. (Bottom-left, in a dashed purple box)
* O₂<sup>H₂</sup>: Priya was disappointed in the quality of the food. (Bottom-right, in a dashed purple box)
### Detailed Analysis
The diagram depicts a scenario where initial observations (O₁ and O₂) lead to the generation of two different hypotheses (H₁ and H₂) by a language model (LM). The "What if" question suggests the LM is exploring different possibilities based on the initial observations. Each hypothesis then leads to a different subsequent observation (O₂<sup>H₁</sup> and O₂<sup>H₂</sup>).
* **Observations (O₁ and O₂):** The initial observations set the context for the scenario. Priya's decision to try a new restaurant and her initial positive impression of the food are the starting points.
* **Hypotheses (H₁ and H₂):** The LM generates two possible explanations for Priya's initial positive impression:
* H₁: She ordered two shrimp dishes.
* H₂: The food that Priya ordered was microwaved and precooked.
* **Language Model (LM):** The LM acts as the reasoning engine, generating hypotheses based on the initial observations.
* **Resulting Observations (O₂<sup>H₁</sup> and O₂<sup>H₂</sup>):** These are the observations that would follow if each hypothesis were true:
* If H₁ is true (she ordered two shrimp dishes), then O₂<sup>H₁</sup>: She was excited to try them out.
* If H₂ is true (the food was microwaved and precooked), then O₂<sup>H₂</sup>: Priya was disappointed in the quality of the food.
### Key Observations
* The diagram illustrates how different hypotheses can lead to different outcomes or subsequent observations.
* The language model plays a central role in generating these hypotheses.
* The diagram highlights the importance of considering multiple possibilities when interpreting observations.
### Interpretation
The diagram demonstrates a simple model of hypothesis generation and evaluation. The LM takes initial observations and generates possible explanations (hypotheses). These hypotheses are then tested or evaluated based on their ability to predict subsequent observations. The diagram suggests that the quality of the hypotheses generated by the LM directly impacts the accuracy of predicting future events or observations. It highlights the iterative nature of the scientific method, where observations lead to hypotheses, which are then tested and refined based on new observations. The diagram also implies that the LM's ability to generate relevant and accurate hypotheses is crucial for effective reasoning and decision-making.