\n
## Chart: QCD K-factor vs. √s
### Overview
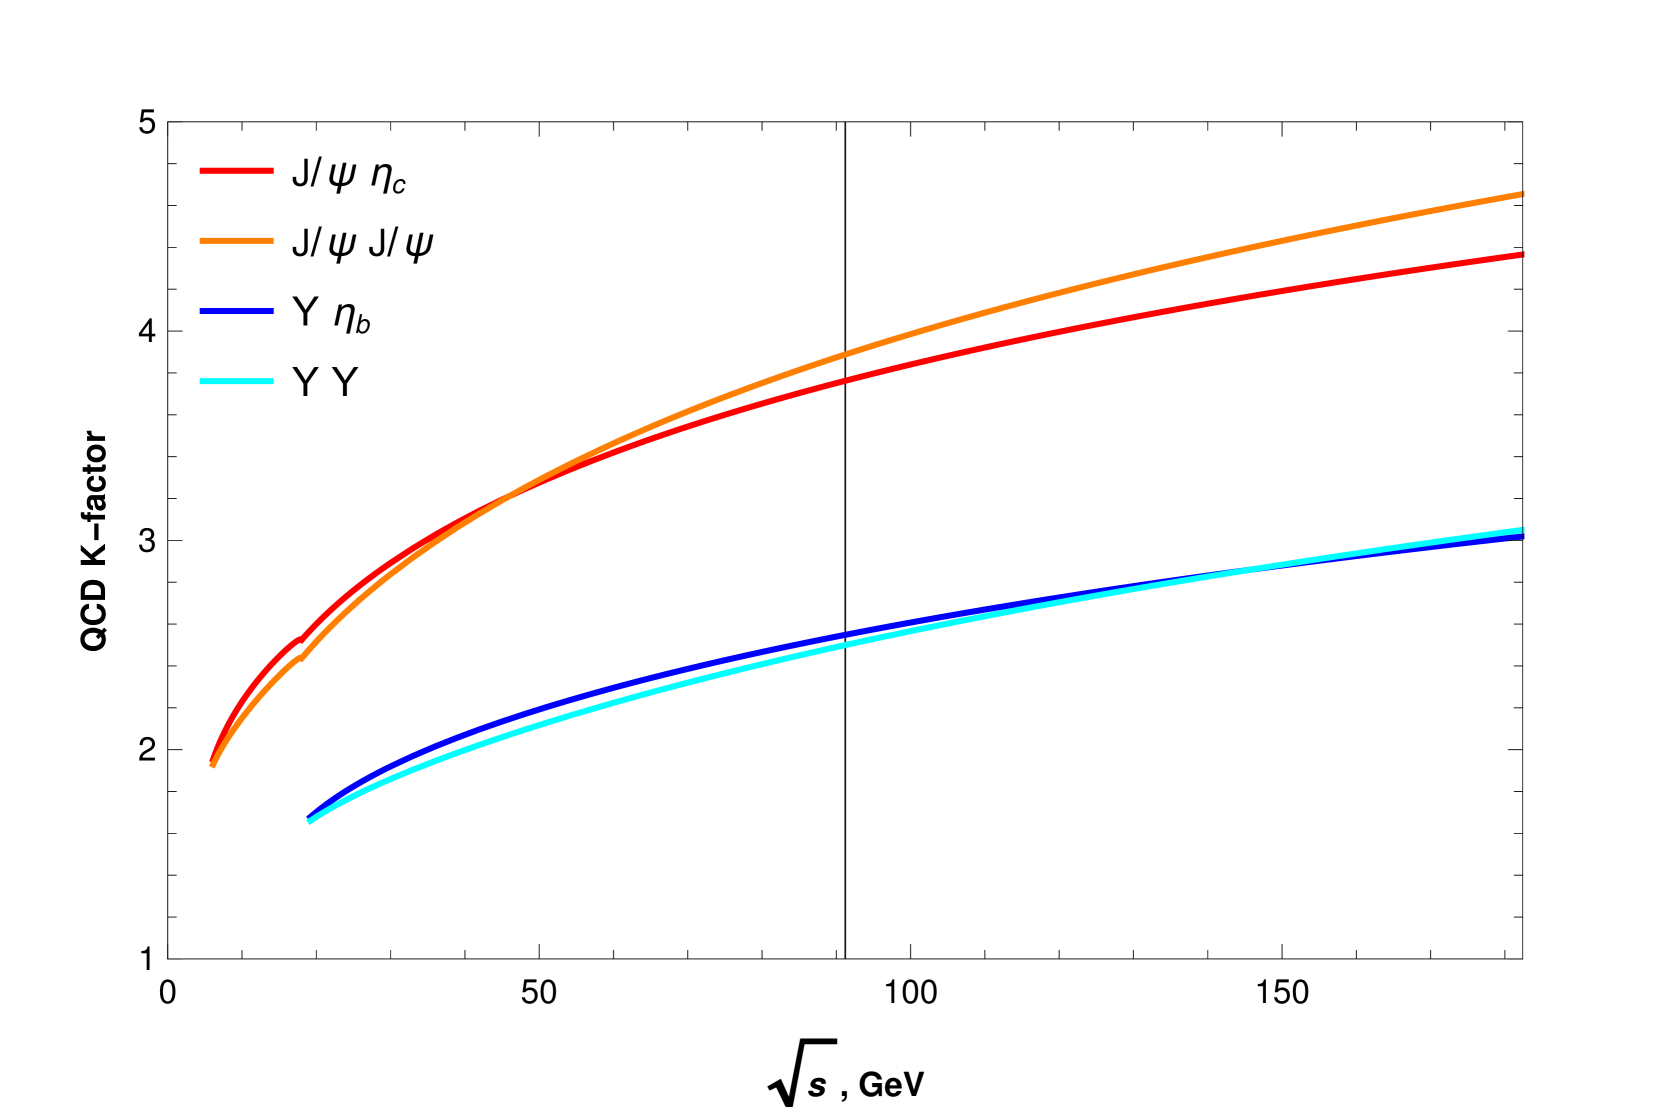
The image presents a line chart illustrating the relationship between the QCD K-factor and the square root of the center-of-mass energy (√s, in GeV). Four different particle combinations are represented by distinct colored lines, showing how the K-factor changes with increasing energy.
### Components/Axes
* **X-axis:** √s (GeV), ranging from 0 to approximately 160 GeV. The axis is labeled "√s , GeV".
* **Y-axis:** QCD K-factor, ranging from 1 to 5. The axis is labeled "QCD K-factor".
* **Legend (Top-Right):**
* Red Line: J/ψ ηc
* Orange Line: J/ψ J/ψ
* Dark Orange Line: γ ηb
* Blue Line: γ γ
### Detailed Analysis
The chart displays four curves, each representing a different particle combination and its corresponding K-factor as a function of √s.
* **J/ψ ηc (Red Line):** This line starts at approximately 2.1 at √s = 0 GeV and increases with a decreasing slope, reaching approximately 4.4 at √s = 160 GeV. The curve exhibits a significant initial rise, then plateaus.
* **J/ψ J/ψ (Orange Line):** This line begins at approximately 3.4 at √s = 0 GeV and increases with a relatively constant, but shallow slope, reaching approximately 4.1 at √s = 160 GeV.
* **γ ηb (Dark Orange Line):** This line starts at approximately 2.4 at √s = 0 GeV and increases with a moderate slope, reaching approximately 3.6 at √s = 160 GeV.
* **γ γ (Blue Line):** This line starts at approximately 1.9 at √s = 0 GeV and increases with a moderate slope, reaching approximately 2.8 at √s = 160 GeV. This line exhibits the lowest K-factor values across the entire energy range.
### Key Observations
* The K-factor generally increases with increasing √s for all particle combinations.
* The J/ψ J/ψ combination consistently exhibits the highest K-factor values.
* The γ γ combination consistently exhibits the lowest K-factor values.
* The rate of increase in K-factor appears to diminish at higher √s values for all combinations.
### Interpretation
This chart likely represents theoretical predictions or experimental measurements of the QCD K-factor for different particle production processes. The K-factor is a multiplicative correction applied to leading-order calculations in perturbative quantum chromodynamics (QCD) to account for higher-order corrections. A higher K-factor indicates that higher-order corrections are more significant.
The differences in K-factor values between the different particle combinations suggest that the higher-order QCD corrections are process-dependent. The J/ψ J/ψ channel having the highest K-factor implies that higher-order corrections are particularly important for this process. Conversely, the γ γ channel having the lowest K-factor suggests that leading-order calculations may be sufficient for this process.
The diminishing rate of increase in K-factor at higher √s values could indicate that the perturbative expansion is becoming less reliable at higher energies, or that non-perturbative effects are becoming more important. The chart provides valuable information for understanding the accuracy of QCD predictions and for guiding experimental searches for these particles.