\n
## Box Plots & Density Plots: LLama Model Performance Comparison
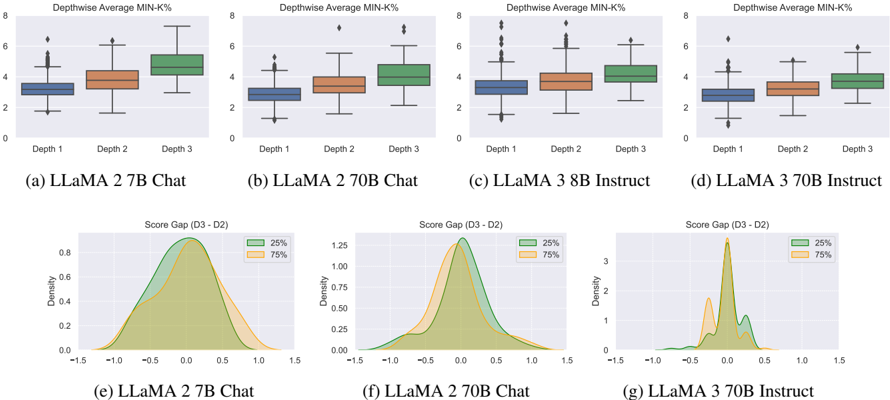
### Overview
The image presents a comparison of LLama model performance across different model sizes (7B, 70B, 3B) and modes (Chat, Instruct) using box plots and density plots. The box plots show the distribution of "Depthwise Average MIN-K%" for different depths (1, 2, 3). The density plots show the distribution of "Score Gap (D3-D2)".
### Components/Axes
* **Box Plots (a-d):**
* **Y-axis:** "Depthwise Average MIN-K%" (Scale: 0 to 8, approximately).
* **X-axis:** "Depth" (Categories: 1, 2, 3).
* **Models:** LLaMA 2 7B Chat (a), LLaMA 2 70B Chat (b), LLaMA 3 8B Instruct (c), LLaMA 3 70B Instruct (d).
* **Density Plots (e-g):**
* **X-axis:** "Score Gap (D3-D2)" (Scale: -1.5 to 1.5, approximately).
* **Y-axis:** "Density" (Scale: 0 to 3, approximately).
* **Models:** LLaMA 2 7B Chat (e), LLaMA 2 70B Chat (f), LLaMA 3 70B Instruct (g).
* **Legend:**
* 25% (Green)
* 75% (Orange)
### Detailed Analysis or Content Details
**Box Plots (a-d):**
* **(a) LLaMA 2 7B Chat:** The median Depthwise Average MIN-K% increases with depth. Depth 1: ~2.5, Depth 2: ~3.5, Depth 3: ~4.5. The interquartile range (IQR) is relatively consistent across depths.
* **(b) LLaMA 2 70B Chat:** Similar trend to (a), with increasing median values with depth. Depth 1: ~2.5, Depth 2: ~3.5, Depth 3: ~5.0. IQR is also relatively consistent.
* **(c) LLaMA 3 8B Instruct:** The median Depthwise Average MIN-K% is relatively stable across depths. Depth 1: ~3.0, Depth 2: ~3.5, Depth 3: ~3.5. IQR is smaller than in (a) and (b).
* **(d) LLaMA 3 70B Instruct:** The median Depthwise Average MIN-K% increases with depth. Depth 1: ~2.5, Depth 2: ~3.5, Depth 3: ~4.5. IQR is relatively consistent.
**Density Plots (e-g):**
* **(e) LLaMA 2 7B Chat:** The distribution is roughly symmetrical around 0, with a peak around 0.0. The 25% and 75% lines indicate the central 50% of the data falls between approximately -0.2 and 0.2.
* **(f) LLaMA 2 70B Chat:** The distribution is skewed to the right, with a peak around 0.2. The 25% line is around -0.1, and the 75% line is around 0.5.
* **(g) LLaMA 3 70B Instruct:** The distribution is highly skewed to the right, with a peak around 0.6. The 25% line is around 0.2, and the 75% line is around 0.9.
### Key Observations
* The 70B models generally show higher Depthwise Average MIN-K% values than the 7B and 8B models, particularly at higher depths.
* The LLaMA 3 8B Instruct model exhibits a more stable Depthwise Average MIN-K% across depths compared to the other models.
* The Score Gap distributions shift to the right as model size increases (from 7B to 70B), indicating a larger difference in scores between depth 3 and depth 2.
* The LLaMA 3 70B Instruct model has a significantly right-skewed Score Gap distribution, suggesting a substantial improvement in performance from depth 2 to depth 3.
### Interpretation
The data suggests that increasing model size (from 7B to 70B) generally improves performance, as indicated by the higher Depthwise Average MIN-K% values and the shift in the Score Gap distributions. The LLaMA 3 8B Instruct model's stable performance across depths might indicate a different optimization strategy or a different sensitivity to depth. The right-skewed Score Gap distribution for the LLaMA 3 70B Instruct model suggests that this model benefits significantly from increasing the depth of processing.
The "Depthwise Average MIN-K%" metric likely represents some measure of model accuracy or confidence at different processing depths. The "Score Gap (D3-D2)" metric quantifies the improvement in performance when increasing the depth from 2 to 3. The combination of these metrics provides insights into how effectively each model utilizes deeper processing layers. The 25% and 75% lines on the density plots show the range of the middle 50% of the data, giving a sense of the spread and consistency of the results. The models are being compared on their ability to improve performance with increased depth.