\n
## Diagram: Autonomous Scientific Discovery Workflow
### Overview
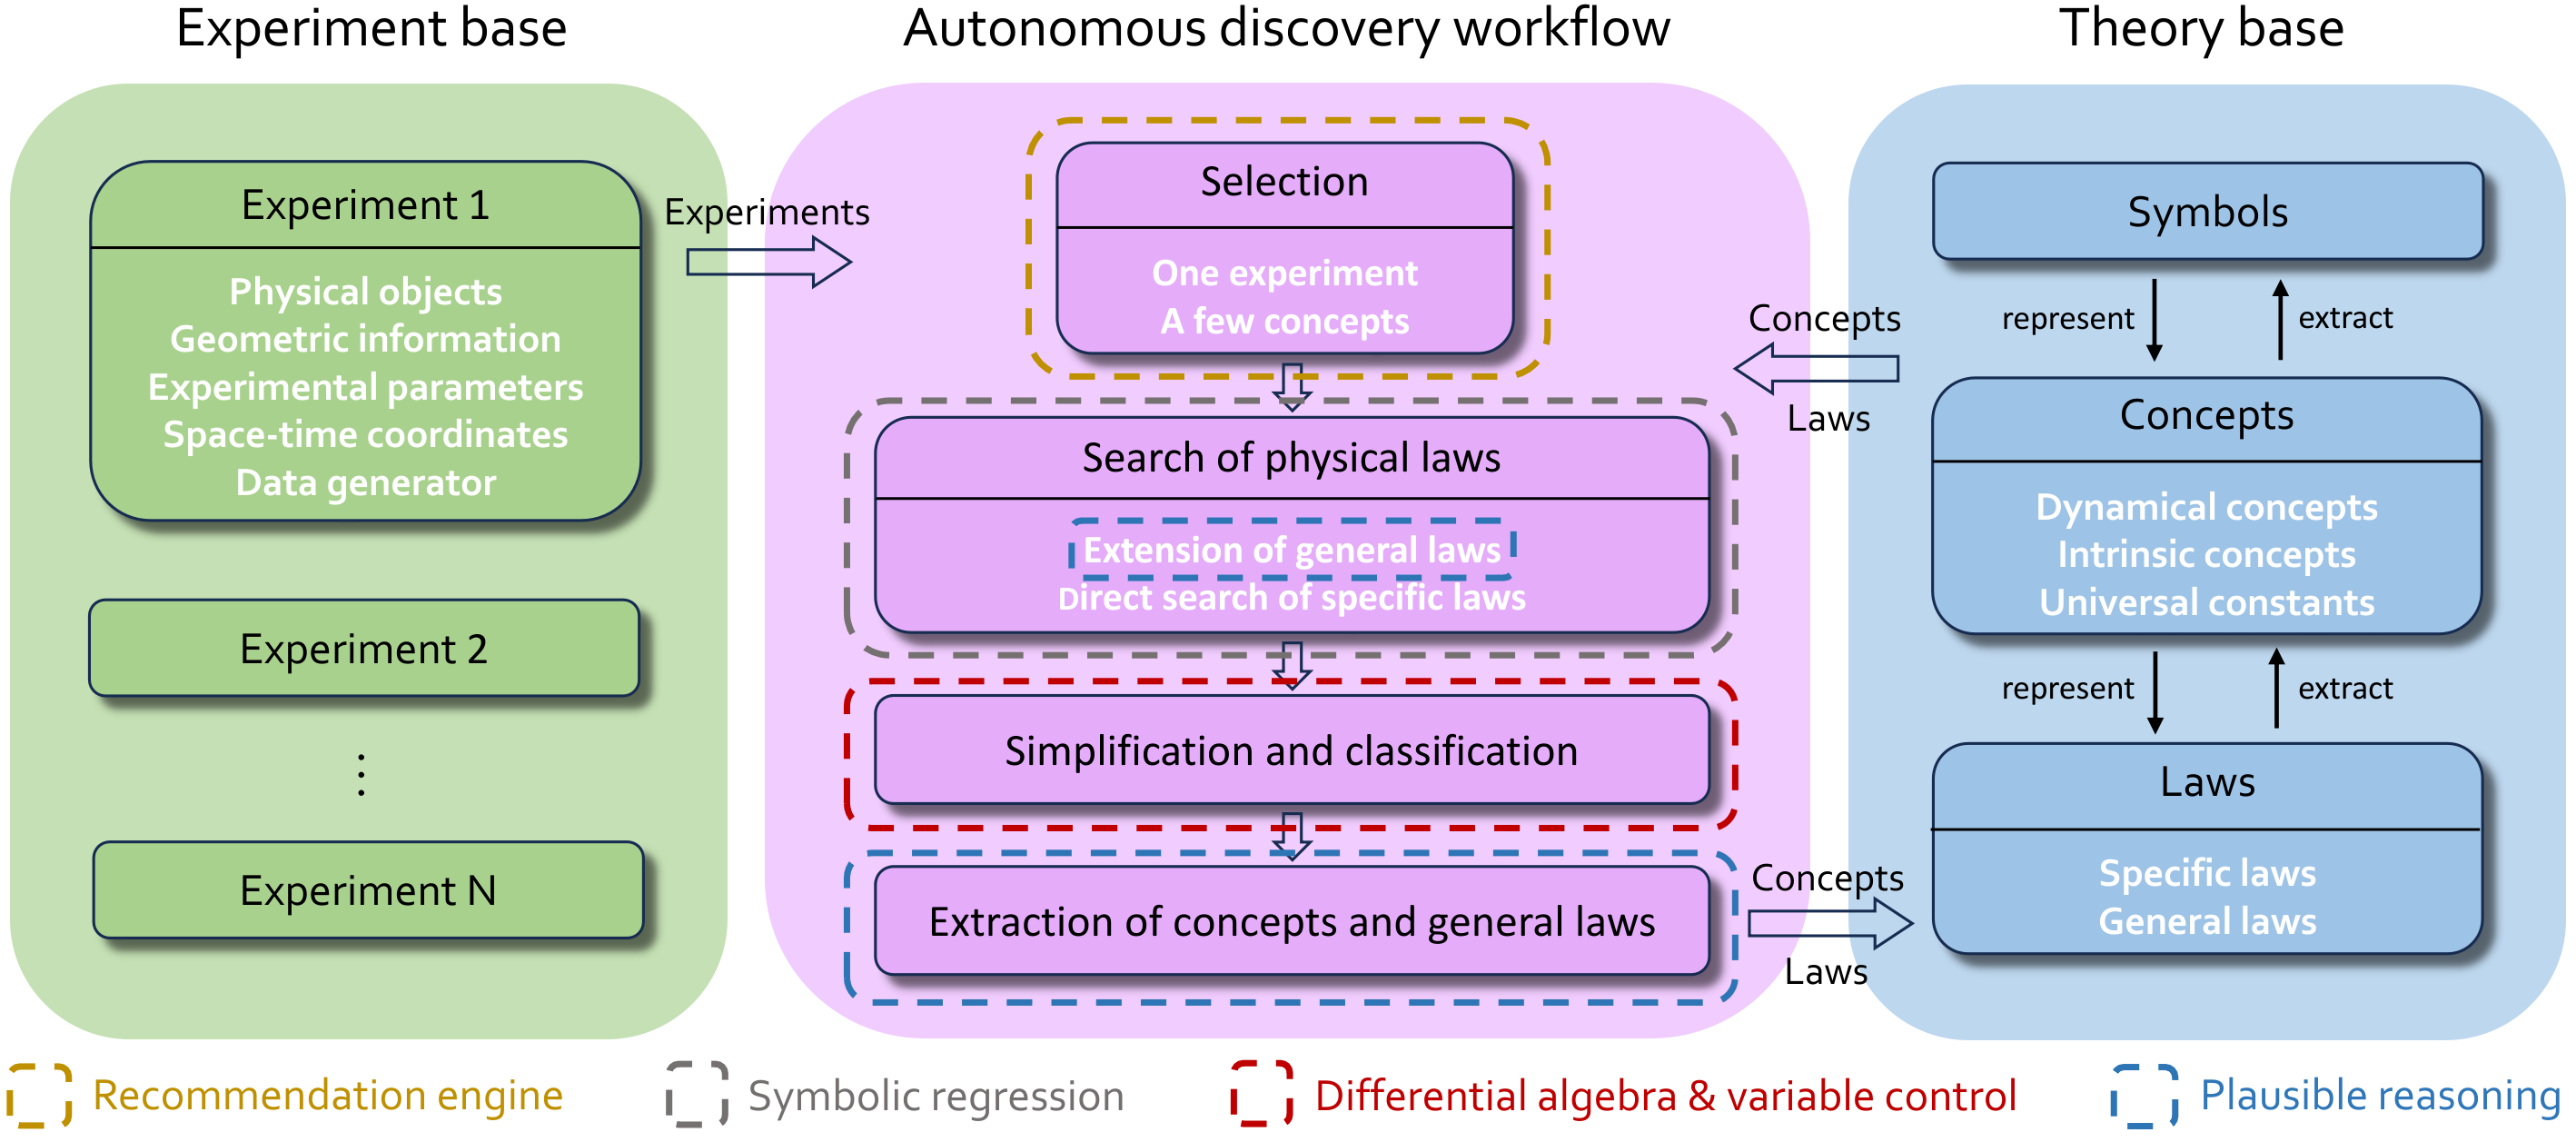
This diagram illustrates an autonomous scientific discovery workflow, connecting an "Experiment base" to a "Theory base" through an "Autonomous discovery workflow" module. The workflow involves selection, search for physical laws, simplification/classification, and extraction of concepts and laws. The diagram highlights the iterative process of refining knowledge from experimental data into theoretical frameworks.
### Components/Axes
The diagram is divided into three main sections:
* **Experiment base (Left):** Contains "Experiment 1", "Experiment 2", and "Experiment N". Each experiment includes "Physical objects", "Geometric information", "Experimental parameters", "Space-time coordinates", and a "Data generator".
* **Autonomous discovery workflow (Center):** This section is further divided into four stages: "Selection", "Search of physical laws", "Simplification and classification", and "Extraction of concepts and general laws". These stages are connected by arrows indicating the flow of information.
* **Theory base (Right):** Contains "Symbols", "Concepts", and "Laws". Concepts are represented by and extracted from Symbols. Laws are represented by and extracted from Concepts. Concepts are categorized into "Dynamical concepts", "Intrinsic concepts", and "Universal constants". Laws are categorized into "Specific laws" and "General laws".
Below the diagram are icons representing supporting technologies: "Recommendation engine", "Symbolic regression", "Differential algebra & variable control", and "Plausible reasoning".
### Detailed Analysis or Content Details
The diagram shows a flow of information from the Experiment base to the Theory base, mediated by the Autonomous discovery workflow.
* **Experiment Base:** The experiments are numbered sequentially (1, 2, N), suggesting a series of iterative experiments. The components within each experiment are listed as text labels.
* **Autonomous Discovery Workflow:**
* **Selection:** This stage receives "Experiments" from the Experiment base and outputs "One experiment" and "A few concepts".
* **Search of physical laws:** This stage receives input from "Selection" and outputs "Laws". Within this stage, there is text stating "Extension of general laws" and "direct search of specific laws".
* **Simplification and classification:** This stage receives input from "Search of physical laws" and outputs nothing explicitly.
* **Extraction of concepts and general laws:** This stage receives input from "Simplification and classification" and outputs "Concepts" and "Laws".
* **Theory Base:**
* **Symbols:** The starting point, leading to Concepts.
* **Concepts:** Categorized as "Dynamical concepts", "Intrinsic concepts", and "Universal constants".
* **Laws:** Categorized as "Specific laws" and "General laws". The diagram shows a bidirectional relationship between Concepts and Laws, with arrows indicating "represent" and "extract".
The supporting technologies are represented by icons at the bottom of the diagram.
### Key Observations
The diagram emphasizes the cyclical nature of scientific discovery. Experiments generate data, which is then processed to extract concepts and laws, which in turn can be used to guide further experimentation. The workflow is designed to automate this process, potentially accelerating the pace of scientific advancement. The distinction between "Specific laws" and "General laws" suggests a hierarchical organization of knowledge.
### Interpretation
This diagram represents a conceptual model for automating the scientific method. It proposes a system where experimental data is not just analyzed by humans, but actively used to refine and expand theoretical knowledge. The workflow is designed to move from concrete observations (experiments) to abstract principles (laws). The inclusion of technologies like "Symbolic regression" and "Differential algebra" suggests that the system relies on advanced mathematical and computational techniques. The "Plausible reasoning" component indicates an attempt to incorporate elements of human intuition and judgment into the automated process.
The diagram suggests a shift from hypothesis-driven research to a more data-driven approach, where theories emerge from the analysis of experimental data rather than being imposed upon it. The iterative nature of the workflow implies that the system is capable of self-correction and refinement, potentially leading to the discovery of novel scientific insights. The diagram does not provide specific data or numerical values, but rather a high-level overview of a proposed system.