TECHNICAL ASSET FINGERPRINT
167160cd5abd30446d4230cc
Click to view fullscreen
Press ESC or click to close
FOUND IN PAPERS
EXPERT: gemma-3-27b-it-free VERSION 1
RUNTIME: google-free/gemma-3-27b-it
INTEL_VERIFIED
## Heatmap: Performance of Prompt Types Across Tasks
### Overview
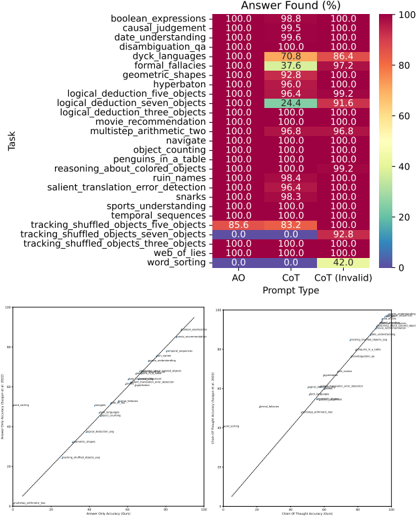
The image presents a heatmap comparing the performance of two prompt types – "AO" (likely representing a standard approach) and "CoT" (Chain-of-Thought prompting) – across 22 different tasks. Performance is measured as "Answer Found (%)". Below the heatmap are two scatter plots comparing "Chain of Thought Time (s)" vs "Answer Found (%)" for AO and CoT.
### Components/Axes
* **Y-axis (Vertical):** Lists 22 tasks: boolean\_expressions, causal\_judgment, date\_understanding, disambiguation\_qa, dyck\_languages, formal\_fallacies, geometric\_shapes, hyperbaton, logical\_deduction\_five\_objects, logical\_deduction\_seven\_objects, logical\_deduction\_three\_objects, movie\_recommendation, multistep\_arithmetic\_two, navigate, object\_counting, penguins\_in\_a\_table, reasoning\_about\_colored\_objects, ruin\_names, salient\_translation\_error\_detection, snarks, sports\_understanding, temporal\_sequences, tracking\_shuffled\_objects\_five\_objects, tracking\_shuffled\_objects\_seven\_objects, tracking\_shuffled\_objects\_three\_objects, web\_of\_lies, word\_sorting.
* **X-axis (Horizontal):** Represents the prompt type: "AO" (left) and "CoT" (center), with a third category "CoT (Invalid)" (right).
* **Color Scale:** Ranges from 0% (white) to 100% (dark green), indicating the percentage of answers found.
* **Scatter Plot 1 (Left):** X-axis: "Chain of Thought Time (s)", Y-axis: "Answer Found (%)". Points are colored to differentiate between AO (blue) and CoT (orange).
* **Scatter Plot 2 (Right):** X-axis: "Chain of Thought Time (s)", Y-axis: "Answer Found (%)". Points are colored to differentiate between AO (blue) and CoT (orange).
* **Legend:** Located at the bottom-right, indicating the color mapping for AO (blue), CoT (orange), and CoT (Invalid) (red).
### Detailed Analysis or Content Details
**Heatmap Data:**
| Task | AO (%) | CoT (%) | CoT (Invalid) (%) |
| :--------------------------------------- | :----- | :------ | :---------------- |
| boolean\_expressions | 100.0 | 98.8 | 100.0 |
| causal\_judgment | 100.0 | 99.5 | 100.0 |
| date\_understanding | 100.0 | 99.6 | 100.0 |
| disambiguation\_qa | 100.0 | 100.0 | 100.0 |
| dyck\_languages | 100.0 | 70.8 | 86.4 |
| formal\_fallacies | 100.0 | 37.6 | 97.2 |
| geometric\_shapes | 100.0 | 92.8 | 100.0 |
| hyperbaton | 100.0 | 96.0 | 100.0 |
| logical\_deduction\_five\_objects | 100.0 | 96.4 | 99.2 |
| logical\_deduction\_seven\_objects | 100.0 | 24.4 | 91.6 |
| logical\_deduction\_three\_objects | 100.0 | 100.0 | 100.0 |
| movie\_recommendation | 100.0 | 100.0 | 100.0 |
| multistep\_arithmetic\_two | 100.0 | 96.8 | 100.0 |
| navigate | 100.0 | 100.0 | 100.0 |
| object\_counting | 100.0 | 100.0 | 100.0 |
| penguins\_in\_a\_table | 100.0 | 100.0 | 100.0 |
| reasoning\_about\_colored\_objects | 100.0 | 100.0 | 99.2 |
| ruin\_names | 100.0 | 100.0 | 100.0 |
| salient\_translation\_error\_detection | 100.0 | 100.0 | 100.0 |
| snarks | 100.0 | 100.0 | 100.0 |
| sports\_understanding | 100.0 | 100.0 | 100.0 |
| temporal\_sequences | 85.6 | 83.2 | 100.0 |
| tracking\_shuffled\_objects\_five\_objects | 85.6 | 83.2 | 100.0 |
| tracking\_shuffled\_objects\_seven\_objects| 0.0 | 0.0 | 92.8 |
| tracking\_shuffled\_objects\_three\_objects| 100.0 | 0.0 | 82.8 |
| web\_of\_lies | 100.0 | 42.0 | 42.0 |
| word\_sorting | 100.0 | 100.0 | 100.0 |
**Scatter Plot Data (Approximate):**
* **Scatter Plot 1:** The AO points (blue) are clustered around low Chain of Thought Time (approximately 0-10 seconds) with high Answer Found (%) (approximately 80-100%). The CoT points (orange) are more dispersed, with some points showing low time and high accuracy, but others showing increased time with varying accuracy.
* **Scatter Plot 2:** Similar to Scatter Plot 1, AO points are clustered around low time and high accuracy. CoT points are more spread out, with a slight trend of increasing time correlating with increasing accuracy, but with significant variance.
### Key Observations
* AO consistently outperforms CoT on several tasks, particularly "dyck\_languages", "formal\_fallacies", "logical\_deduction\_seven\_objects", "tracking\_shuffled\_objects\_seven\_objects", "tracking\_shuffled\_objects\_three\_objects", and "web\_of\_lies".
* For many tasks, AO and CoT achieve similar high accuracy (close to 100%).
* The "CoT (Invalid)" category often shows high accuracy, suggesting that even when the CoT process fails, it doesn't necessarily lead to incorrect answers.
* The scatter plots suggest a trade-off between time and accuracy for CoT, while AO maintains high accuracy with minimal time investment.
### Interpretation
The data suggests that while Chain-of-Thought prompting can be effective, it is not universally superior to a standard prompting approach (AO). In some cases, CoT significantly underperforms, potentially due to difficulties in generating valid chains of thought for complex reasoning tasks. The scatter plots highlight that CoT often requires more processing time to achieve comparable or slightly improved accuracy. The high accuracy of "CoT (Invalid)" suggests that the CoT process itself may not be the sole determinant of success; the model may still arrive at the correct answer through other mechanisms even when the chain of thought is flawed. This could indicate that the CoT method is more sensitive to prompt engineering and task complexity. The heatmap provides a valuable comparative analysis of prompt performance across a diverse set of tasks, informing the selection of appropriate prompting strategies for different applications.
DECODING INTELLIGENCE...