## Line Chart: MLU-Pro vs RL Training Steps
### Overview
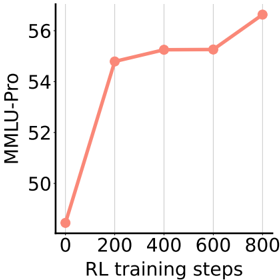
The chart illustrates the relationship between RL (Reinforcement Learning) training steps and MLU-Pro performance metrics. A single red line represents the progression of MLU-Pro values across increasing training steps, showing a non-linear trend with distinct phases of growth and plateau.
### Components/Axes
- **X-axis**: "RL training steps" (0 to 800), marked at intervals of 200.
- **Y-axis**: "MLU-Pro" (48 to 56), with increments of 2.
- **Legend**: Located in the top-right corner, associating the red line with "MLU-Pro."
- **Line**: Red, solid, with circular markers at data points.
### Detailed Analysis
- **Data Points**:
- (0, 48.0 ± 0.5)
- (200, 54.5 ± 0.5)
- (400, 55.0 ± 0.5)
- (600, 55.0 ± 0.5)
- (800, 56.5 ± 0.5)
- **Trend**:
- Initial sharp increase from 48 to 54.5 between 0 and 200 steps.
- Plateau from 200 to 600 steps (54.5 to 55.0).
- Final rise from 55.0 to 56.5 between 600 and 800 steps.
### Key Observations
- The plateau between 200–600 steps suggests diminishing returns during mid-training.
- The final upward trend indicates renewed improvement at higher step counts.
- No anomalies or outliers; all data points align with the red line.
### Interpretation
The chart demonstrates that MLU-Pro performance improves significantly in early training phases, stabilizes during mid-training, and then accelerates again toward the end. This pattern may reflect:
1. **Initial Learning**: Rapid adaptation to basic tasks.
2. **Stabilization**: Convergence toward optimal strategies.
3. **Advanced Optimization**: Fine-tuning or discovery of novel solutions at higher step counts.
The red line’s consistent upward trajectory overall suggests a positive correlation between training duration and performance, though the plateau phase highlights potential inefficiencies in mid-stage training. Further analysis could explore whether the final rise correlates with specific algorithmic adjustments or data exposure.