## Chart Type: Multiple Line Charts
### Overview
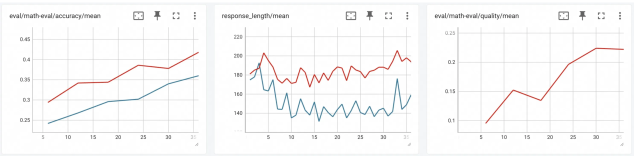
The image presents three line charts side-by-side, each displaying the trend of a different metric over a range of values from approximately 5 to 35 on the x-axis. The charts are titled "eval/math-eval/accuracy/mean", "response_length/mean", and "eval/math-eval/quality/mean". Each chart contains two data series, represented by a red and a blue line, except for the "eval/math-eval/quality/mean" chart, which only contains a red line.
### Components/Axes
**Chart 1: eval/math-eval/accuracy/mean**
* **Title:** eval/math-eval/accuracy/mean
* **X-axis:** Ranges from approximately 5 to 35 in increments of 5.
* **Y-axis:** Ranges from 0.25 to 0.45 in increments of 0.05.
* **Data Series:**
* Red Line: Represents one data series.
* Blue Line: Represents another data series.
**Chart 2: response_length/mean**
* **Title:** response_length/mean
* **X-axis:** Ranges from approximately 5 to 35 in increments of 5.
* **Y-axis:** Ranges from 140 to 220 in increments of 20.
* **Data Series:**
* Red Line: Represents one data series.
* Blue Line: Represents another data series.
**Chart 3: eval/math-eval/quality/mean**
* **Title:** eval/math-eval/quality/mean
* **X-axis:** Ranges from approximately 5 to 35 in increments of 5.
* **Y-axis:** Ranges from 0.1 to 0.25 in increments of 0.05.
* **Data Series:**
* Red Line: Represents one data series.
### Detailed Analysis
**Chart 1: eval/math-eval/accuracy/mean**
* **Red Line:** Starts at approximately 0.29 at x=5, increases to approximately 0.34 at x=15, remains relatively stable until x=20, then increases to approximately 0.39 at x=25, and remains relatively stable until x=35.
* **Blue Line:** Starts at approximately 0.24 at x=5, increases to approximately 0.27 at x=15, increases to approximately 0.30 at x=20, and continues to increase to approximately 0.35 at x=35.
**Chart 2: response_length/mean**
* **Red Line:** Starts at approximately 180 at x=5, increases to approximately 202 at x=7, then fluctuates between approximately 175 and 195 until x=35.
* **Blue Line:** Starts at approximately 185 at x=5, decreases to approximately 140 at x=7, then fluctuates between approximately 140 and 160 until x=35.
**Chart 3: eval/math-eval/quality/mean**
* **Red Line:** Starts at approximately 0.10 at x=5, increases to approximately 0.15 at x=10, decreases to approximately 0.13 at x=15, increases to approximately 0.20 at x=25, and remains relatively stable at approximately 0.22 until x=35.
### Key Observations
* In the "eval/math-eval/accuracy/mean" chart, both the red and blue lines show an upward trend, indicating an increase in accuracy as the x-axis value increases.
* In the "response_length/mean" chart, the red line shows more variability than the blue line. The blue line fluctuates more rapidly.
* In the "eval/math-eval/quality/mean" chart, the red line shows an upward trend, indicating an increase in quality as the x-axis value increases, before plateauing.
### Interpretation
The charts provide a comparative analysis of accuracy, response length, and quality, likely in the context of a math evaluation. The "eval/math-eval/accuracy/mean" chart suggests that both data series improve in accuracy as the x-axis value increases, with the red line consistently showing higher accuracy than the blue line. The "response_length/mean" chart shows different patterns for the two data series, with the red line showing more variability and the blue line fluctuating more rapidly. The "eval/math-eval/quality/mean" chart indicates that the quality increases with the x-axis value, before plateauing. The x-axis likely represents a parameter or iteration number. The red and blue lines likely represent different models or configurations.