## Line Chart: Energy vs. $\epsilon$ for varying $K_s$ values
### Overview
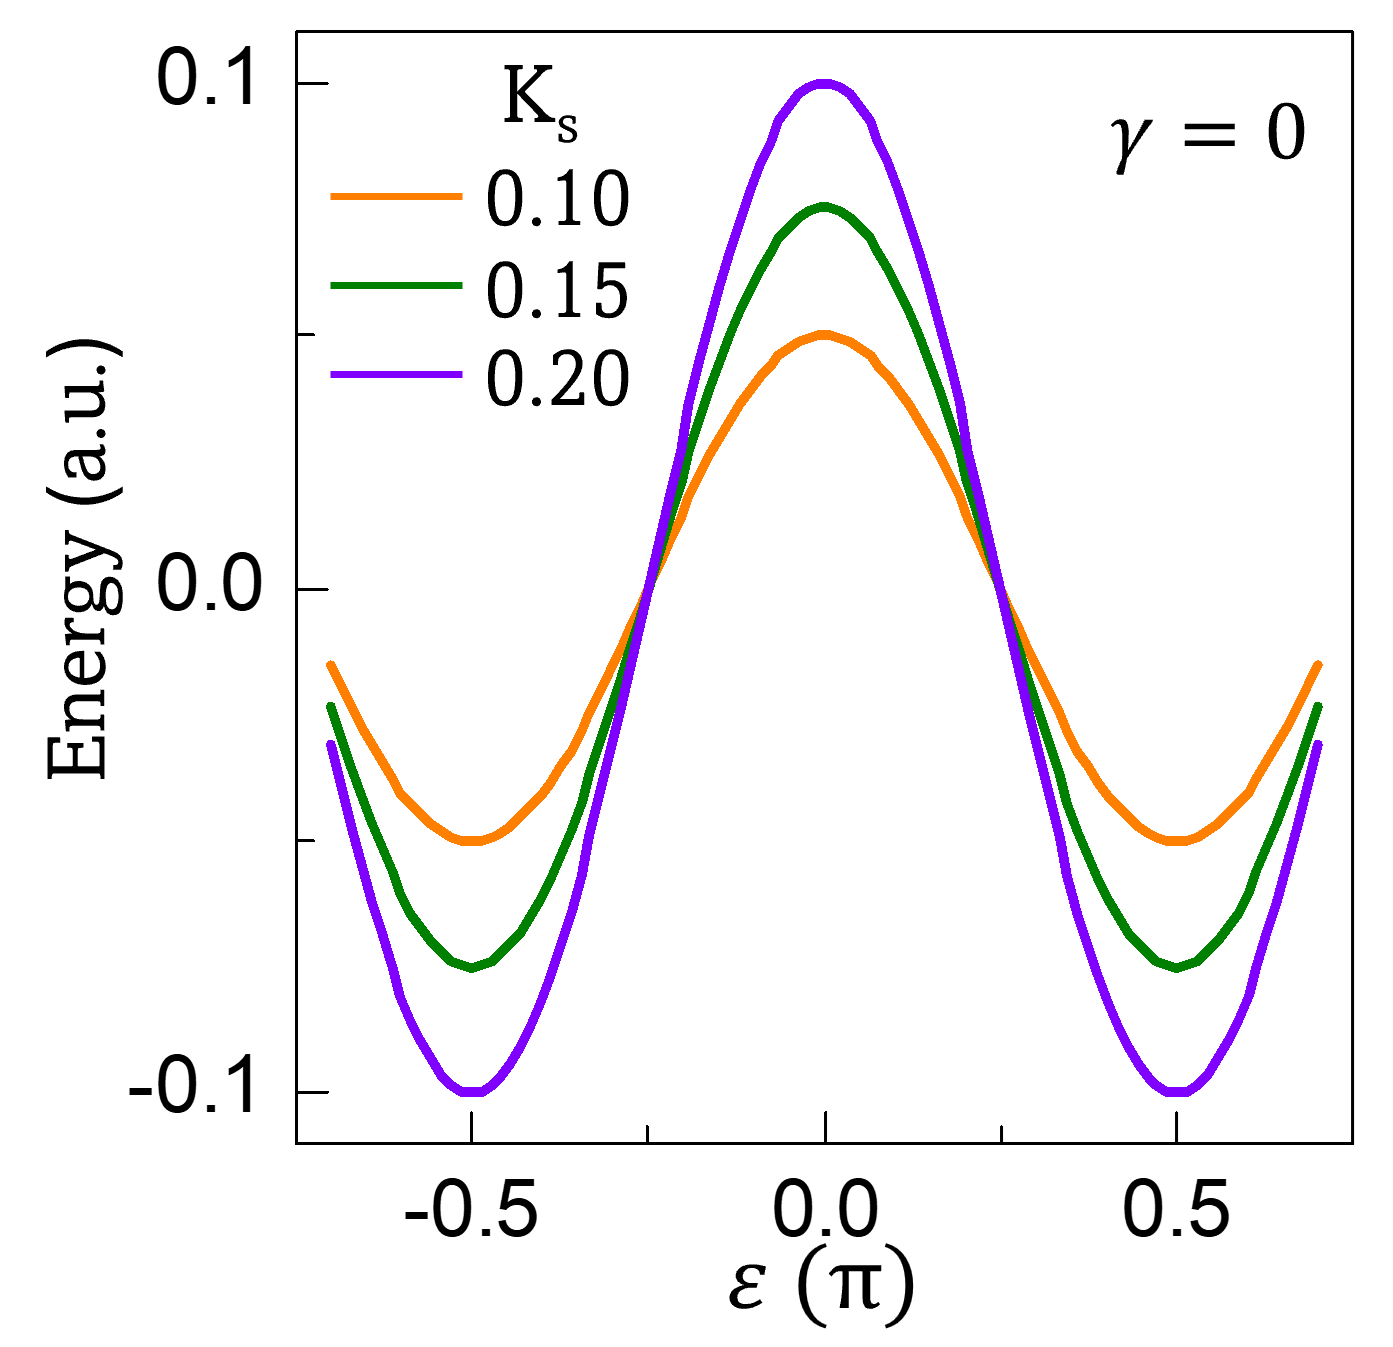
This image displays a scientific line plot illustrating the relationship between Energy (in arbitrary units) and a variable $\epsilon$ (in units of $\pi$). The plot compares three distinct curves, each corresponding to a specific value of the parameter $K_s$ (0.10, 0.15, and 0.20), while holding the parameter $\gamma$ constant at 0.
### Components/Axes
* **Y-Axis:** Labeled "Energy (a.u.)". The scale ranges from -0.1 to 0.1, with major ticks at -0.1, 0.0, and 0.1.
* **X-Axis:** Labeled "$\epsilon$ ($\pi$)". The scale ranges from approximately -0.7 to 0.7, with major ticks at -0.5, 0.0, and 0.5.
* **Legend:** Located in the top-left quadrant. It defines the color-coding for the parameter $K_s$:
* **Orange line:** $K_s = 0.10$
* **Green line:** $K_s = 0.15$
* **Purple line:** $K_s = 0.20$
* **Annotation:** Located in the top-right corner: "$\gamma = 0$".
### Detailed Analysis
The plot displays three oscillatory curves that are symmetric about the vertical axis ($\epsilon = 0$).
**Trend Verification:**
* All three curves exhibit a local maximum at $\epsilon = 0$.
* All three curves exhibit local minima at $\epsilon \approx \pm 0.5$.
* The curves intersect at approximately $\epsilon \approx \pm 0.25$ and $\epsilon \approx \pm 0.75$.
**Data Points (Approximate Values):**
| Parameter ($K_s$) | Color | Energy at $\epsilon = 0$ (Max) | Energy at $\epsilon = \pm 0.5$ (Min) |
| :--- | :--- | :--- | :--- |
| **0.10** | Orange | $\approx +0.05$ | $\approx -0.05$ |
| **0.15** | Green | $\approx +0.07$ | $\approx -0.07$ |
| **0.20** | Purple | $\approx +0.10$ | $\approx -0.10$ |
*Note: The values are estimated based on visual alignment with the grid lines.*
### Key Observations
* **Amplitude Scaling:** The amplitude of the energy oscillation is directly proportional to the value of $K_s$. As $K_s$ increases from 0.10 to 0.20, the peak-to-trough distance increases significantly.
* **Crossover Points:** The curves are not parallel; they intersect at specific points ($\epsilon \approx \pm 0.25$ and $\epsilon \approx \pm 0.75$). At these points, the energy value is independent of the $K_s$ parameter.
* **Symmetry:** The system demonstrates perfect mirror symmetry across the y-axis ($\epsilon = 0$).
### Interpretation
This plot is characteristic of a dispersion relation in condensed matter physics, likely representing the energy band structure of a periodic system (such as a 1D lattice).
* **Physical Significance:** The parameter $K_s$ likely represents a coupling strength or a hopping parameter. Increasing $K_s$ increases the bandwidth (the difference between the maximum and minimum energy), suggesting stronger interaction or tighter binding as $K_s$ increases.
* **The Crossover:** The intersection points at $\epsilon \approx \pm 0.25$ suggest a "node" or a point of degeneracy where the energy state is invariant to changes in the coupling parameter $K_s$.
* **Context:** The plot describes a system where energy is periodic with respect to $\epsilon$. The behavior is consistent with a tight-binding model where the energy dispersion is modulated by the parameter $K_s$. The condition $\gamma = 0$ implies this is a specific slice of a larger parameter space, likely representing a system without a specific type of asymmetry or bias (e.g., no external field or specific phase factor).