## Line Charts: Age-Related Rates in Spain
### Overview
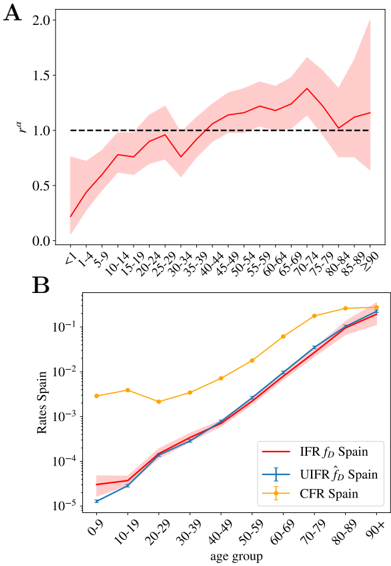
The image contains two line charts analyzing age-related epidemiological rates in Spain. Chart A shows a single metric (rσ) across age groups with a reference threshold, while Chart B compares three distinct rates (IFR, UIFR, CFR) across the lifespan. Both charts use age groups as the x-axis and logarithmic/linear scales for rates.
### Components/Axes
**Chart A:**
- **X-axis**: Age groups labeled as "<1", "1-4", "5-9", ..., "≥90" (categorical, non-linear spacing)
- **Y-axis**: "rσ" (linear scale, 0.0–2.0)
- **Legend**: Red line represents primary data series (no explicit label, inferred from context)
- **Additional elements**: Dashed black reference line at y=1.0
**Chart B:**
- **X-axis**: Age groups labeled "0-9", "10-19", ..., "90+" (categorical, non-linear spacing)
- **Y-axis**: "Rates Spain" (logarithmic scale, 10⁻⁵–10⁻¹)
- **Legend**:
- Red: IFR f_D Spain
- Blue: UIFR f_D Spain
- Yellow: CFR Spain
- **Error indicators**: Blue line has error bars (vertical lines with caps)
### Detailed Analysis
**Chart A Trends:**
- Red line starts at ~0.3 (age "<1"), rises to ~1.2 by age "40-49", then fluctuates between 1.0–1.4 until "≥90"
- Shaded area (confidence interval) widens significantly after age "60-69"
- Dashed reference line at y=1.0 acts as a threshold (crossed at ~age "30-39")
**Chart B Trends:**
- All three lines show exponential growth with age
- CFR Spain (yellow) consistently highest, reaching ~10⁻¹ by "90+"
- IFR Spain (red) and UIFR Spain (blue) converge at older ages (~10⁻² by "80-89")
- Blue line (UIFR) shows larger error margins (error bars) than red line
### Key Observations
1. **Threshold Breach**: Chart A's rσ metric crosses the critical threshold (1.0) at middle age, suggesting increased risk/severity in older populations.
2. **Rate Divergence**: Chart B reveals CFR Spain is 10–100x higher than IFR/UFR rates in all age groups.
3. **Uncertainty Patterns**: Blue line (UIFR) has visibly larger error margins, particularly in younger age groups.
4. **Log-Scale Impact**: Chart B's logarithmic y-axis emphasizes exponential growth in rates with age.
### Interpretation
The data suggests age is a critical factor in Spanish epidemiological outcomes:
- **Chart A** likely measures a composite risk metric (rσ) that becomes statistically significant (>1.0) in middle-aged populations, with measurement uncertainty increasing in elderly cohorts.
- **Chart B** demonstrates that case fatality rates (CFR) dominate over infection fatality rates (IFR) and underlying infection fatality rates (UIFR), particularly in centenarians. The convergence of IFR and UIFR at older ages may indicate underreporting of mild cases in geriatric populations.
- The larger error margins in UIFR estimates (blue line) suggest methodological challenges in measuring subclinical infections, especially in younger age groups where infection rates may be higher but less clinically apparent.
*Note: All values are approximate due to lack of gridlines. Logarithmic scale in Chart B compresses older age group differences.*