\n
## Scatter Plot: Confidence vs. Target Length (High School Geography)
### Overview
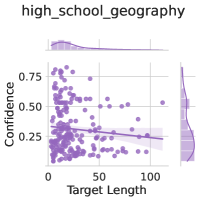
This image presents a scatter plot visualizing the relationship between "Target Length" and "Confidence" for data labeled as "high_school_geography". A regression line with a shaded confidence interval is overlaid on the scatter points. Marginal distributions (histograms) are displayed above and to the right of the main scatter plot, showing the distributions of Target Length and Confidence, respectively.
### Components/Axes
* **X-axis:** "Target Length" - Scale ranges from approximately 0 to 110.
* **Y-axis:** "Confidence" - Scale ranges from approximately 0.15 to 0.80.
* **Title:** "high_school_geography" - Located at the top-center of the image.
* **Scatter Points:** Purple circles representing individual data points.
* **Regression Line:** A dark purple line representing the trend of the data. It slopes downward.
* **Confidence Interval:** A light purple shaded area around the regression line, indicating the uncertainty in the estimated trend.
* **Marginal Distribution (Top):** A histogram showing the distribution of "Target Length".
* **Marginal Distribution (Right):** A histogram showing the distribution of "Confidence".
### Detailed Analysis
The scatter plot shows a generally negative correlation between "Target Length" and "Confidence". As "Target Length" increases, "Confidence" tends to decrease.
* **Regression Line Trend:** The regression line has a negative slope, confirming the negative correlation.
* **Data Point Distribution:** The data points are scattered, but a clear downward trend is visible.
* **Target Length Distribution:** The distribution of "Target Length" is skewed to the right, with a higher concentration of values near 0 and a tail extending towards 110. The peak of the distribution is around 10.
* **Confidence Distribution:** The distribution of "Confidence" is concentrated between 0.2 and 0.4, with a slight skew towards lower values. The peak of the distribution is around 0.25.
Let's attempt to extract some approximate data points from the scatter plot:
* At Target Length = 0, Confidence ranges from approximately 0.3 to 0.7.
* At Target Length = 25, Confidence ranges from approximately 0.2 to 0.6.
* At Target Length = 50, Confidence ranges from approximately 0.15 to 0.5.
* At Target Length = 75, Confidence ranges from approximately 0.1 to 0.4.
* At Target Length = 100, Confidence ranges from approximately 0.1 to 0.3.
The regression line appears to intersect the Y-axis (Confidence) at approximately 0.3. The slope of the regression line is approximately -0.005 (estimated visually).
### Key Observations
* The negative correlation suggests that longer "Target Lengths" are associated with lower "Confidence" scores.
* The marginal distributions provide insights into the range and distribution of each variable independently.
* The confidence interval around the regression line indicates the uncertainty in the estimated relationship.
### Interpretation
This data likely represents a model's performance on a task related to "high_school_geography". "Target Length" could refer to the length of a question, answer, or text passage. "Confidence" could represent the model's certainty in its prediction or response.
The negative correlation suggests that the model is less confident when dealing with longer inputs. This could be due to several factors:
* **Increased Complexity:** Longer inputs may be more complex and require more reasoning, leading to lower confidence.
* **Data Sparsity:** The model may have less training data for longer inputs, resulting in lower confidence.
* **Attention Limitations:** The model may struggle to attend to all relevant information in longer inputs.
The marginal distributions indicate that the "Target Length" is relatively short on average, while the "Confidence" scores are generally moderate. The confidence interval around the regression line suggests that the relationship between "Target Length" and "Confidence" is not very strong, and there is considerable variability in the data.
Further investigation would be needed to understand the specific context of this data and the underlying reasons for the observed relationship.