\n
## Bar Chart: LLM Performance on Code Logic Metrics
### Overview
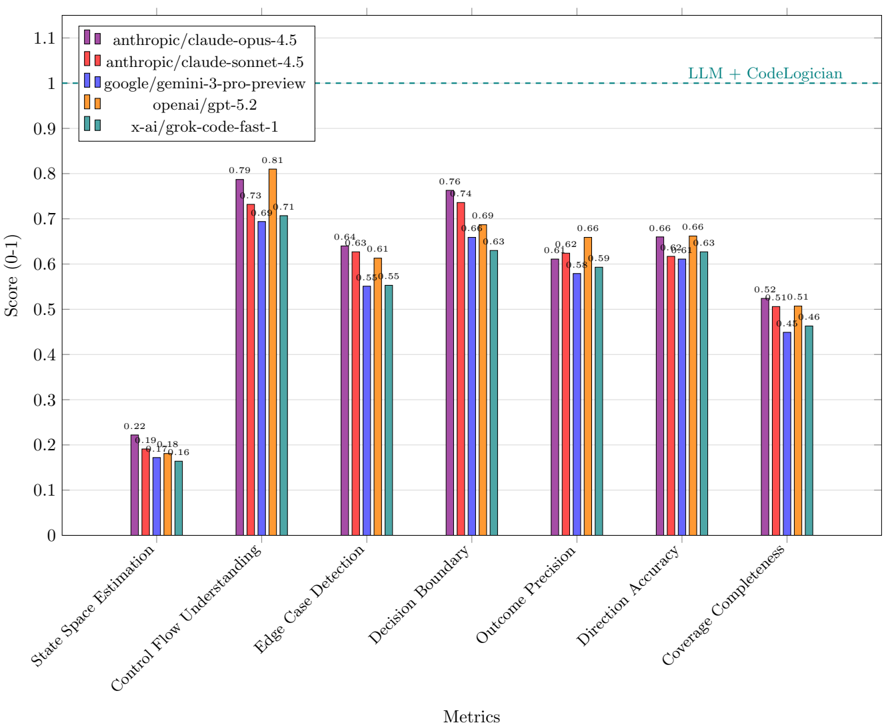
This bar chart compares the performance of several Large Language Models (LLMs) across seven different metrics related to code logic understanding and reasoning. The metrics are displayed on the x-axis, and the score (ranging from 0 to 1) is displayed on the y-axis. A dashed horizontal line at y=1 is present, labeled "LLM + CodeLogician".
### Components/Axes
* **X-axis:** "Metrics" - Categorical axis with the following labels: "State Space Estimation", "Control Flow Understanding", "Edge Case Detection", "Decision Boundary", "Outcome Precision", "Direction Accuracy", "Coverage Completeness".
* **Y-axis:** "Score (0-1)" - Numerical axis ranging from 0 to 1.1, with increments of 0.1.
* **Legend:** Located at the top-right of the chart. Contains the following LLM names and corresponding colors:
* anthropic/claude-opus-4.5 (Purple)
* anthropic/claude-sonnet-4.5 (Red)
* google/gemini-3-pro-preview (Orange)
* openai/gpt-5.2 (Yellow)
* x-ai/grok-code-fast-1 (Teal)
* **Horizontal Line:** Dashed line at y=1, labeled "LLM + CodeLogician".
### Detailed Analysis
The chart consists of seven groups of bars, one for each metric. Each group contains five bars, representing the performance of each LLM on that metric.
**1. State Space Estimation:**
* anthropic/claude-opus-4.5: Approximately 0.22
* anthropic/claude-sonnet-4.5: Approximately 0.19
* google/gemini-3-pro-preview: Approximately 0.16
* openai/gpt-5.2: Approximately 0.18
* x-ai/grok-code-fast-1: Approximately 0.14
**2. Control Flow Understanding:**
* anthropic/claude-opus-4.5: Approximately 0.79
* anthropic/claude-sonnet-4.5: Approximately 0.68
* google/gemini-3-pro-preview: Approximately 0.71
* openai/gpt-5.2: Approximately 0.66
* x-ai/grok-code-fast-1: Approximately 0.58
**3. Edge Case Detection:**
* anthropic/claude-opus-4.5: Approximately 0.81
* anthropic/claude-sonnet-4.5: Approximately 0.61
* google/gemini-3-pro-preview: Approximately 0.63
* openai/gpt-5.2: Approximately 0.55
* x-ai/grok-code-fast-1: Approximately 0.61
**4. Decision Boundary:**
* anthropic/claude-opus-4.5: Approximately 0.76
* anthropic/claude-sonnet-4.5: Approximately 0.64
* google/gemini-3-pro-preview: Approximately 0.74
* openai/gpt-5.2: Approximately 0.63
* x-ai/grok-code-fast-1: Approximately 0.63
**5. Outcome Precision:**
* anthropic/claude-opus-4.5: Approximately 0.69
* anthropic/claude-sonnet-4.5: Approximately 0.66
* google/gemini-3-pro-preview: Approximately 0.68
* openai/gpt-5.2: Approximately 0.62
* x-ai/grok-code-fast-1: Approximately 0.58
**6. Direction Accuracy:**
* anthropic/claude-opus-4.5: Approximately 0.66
* anthropic/claude-sonnet-4.5: Approximately 0.62
* google/gemini-3-pro-preview: Approximately 0.59
* openai/gpt-5.2: Approximately 0.66
* x-ai/grok-code-fast-1: Approximately 0.63
**7. Coverage Completeness:**
* anthropic/claude-opus-4.5: Approximately 0.52
* anthropic/claude-sonnet-4.5: Approximately 0.51
* google/gemini-3-pro-preview: Approximately 0.51
* openai/gpt-5.2: Approximately 0.46
* x-ai/grok-code-fast-1: Approximately 0.45
### Key Observations
* anthropic/claude-opus-4.5 consistently performs the best across all metrics, often significantly higher than other models.
* x-ai/grok-code-fast-1 generally performs the worst across most metrics.
* The largest performance differences between models are observed in "State Space Estimation" and "Control Flow Understanding".
* The "LLM + CodeLogician" line at y=1 suggests a potential upper bound or target performance level. No model consistently reaches this level.
* The scores for "Coverage Completeness" are generally lower than other metrics, indicating this is a challenging area for all models.
### Interpretation
The chart demonstrates the varying capabilities of different LLMs in understanding and reasoning about code logic. anthropic/claude-opus-4.5 emerges as the strongest performer, suggesting it possesses superior abilities in areas like control flow analysis, edge case detection, and decision-making within code. The "LLM + CodeLogician" line implies that combining LLMs with dedicated code analysis tools could potentially achieve perfect performance (score of 1) on these metrics. The relatively low scores for "Coverage Completeness" across all models highlight the difficulty of ensuring comprehensive code coverage analysis using LLMs alone. The data suggests that while LLMs are making progress in code understanding, there is still significant room for improvement, particularly in areas requiring thoroughness and completeness. The differences in performance between models could be attributed to variations in model architecture, training data, and specific optimization strategies.