\n
## Line Chart: Mean Firing Rate vs. Epoch
### Overview
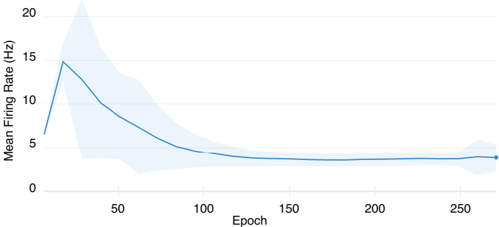
The image presents a line chart illustrating the relationship between "Epoch" on the x-axis and "Mean Firing Rate (Hz)" on the y-axis. A single blue line represents the mean firing rate, with a shaded light blue area indicating the standard deviation or confidence interval around the mean. The chart demonstrates a decreasing trend in mean firing rate as the epoch increases.
### Components/Axes
* **X-axis:** Labeled "Epoch". The scale ranges from approximately 0 to 280, with tick marks at intervals of 50.
* **Y-axis:** Labeled "Mean Firing Rate (Hz)". The scale ranges from approximately 0 to 20, with tick marks at intervals of 5.
* **Data Series:** A single blue line representing the mean firing rate.
* **Confidence Interval:** A light blue shaded area surrounding the blue line, representing the variability or uncertainty in the mean firing rate.
### Detailed Analysis
The blue line starts at approximately 16 Hz at Epoch 0. The line then exhibits a steep downward slope until approximately Epoch 50, where the mean firing rate is around 8 Hz. From Epoch 50 to Epoch 200, the slope becomes less steep, and the mean firing rate gradually decreases to approximately 3 Hz. Between Epoch 200 and Epoch 280, the line plateaus, with the mean firing rate fluctuating around 3 Hz.
Here's a breakdown of approximate data points:
* Epoch 0: ~16 Hz
* Epoch 25: ~12 Hz
* Epoch 50: ~8 Hz
* Epoch 75: ~6 Hz
* Epoch 100: ~5 Hz
* Epoch 150: ~4 Hz
* Epoch 200: ~3.5 Hz
* Epoch 250: ~3.2 Hz
* Epoch 280: ~3.1 Hz
The shaded area (confidence interval) is widest at the beginning of the chart (Epoch 0-50), indicating greater variability in the mean firing rate during this period. As the epoch increases, the shaded area narrows, suggesting a reduction in variability.
### Key Observations
* The mean firing rate decreases significantly during the initial epochs (0-50).
* The rate of decrease slows down after Epoch 50.
* The mean firing rate appears to stabilize around 3 Hz after Epoch 200.
* The confidence interval decreases over time, indicating increasing certainty in the mean firing rate as the epoch progresses.
### Interpretation
This chart likely represents the learning or adaptation process of a neural system or neuron. The decreasing mean firing rate suggests that the system is becoming more efficient or desensitized over time. The initial steep decrease could represent a rapid learning phase, while the subsequent plateau indicates that the system has reached a stable state. The narrowing confidence interval suggests that the system's response becomes more consistent as it learns. This could be observed in a biological neuron adapting to a stimulus, or in an artificial neural network during training. The data suggests a process of habituation or adaptation, where the initial response is strong, but diminishes with repeated exposure. The stabilization at around 3 Hz could represent a baseline level of activity or a point of saturation.