## Loss Curve: NEMESYS Learning Across Tasks
### Overview
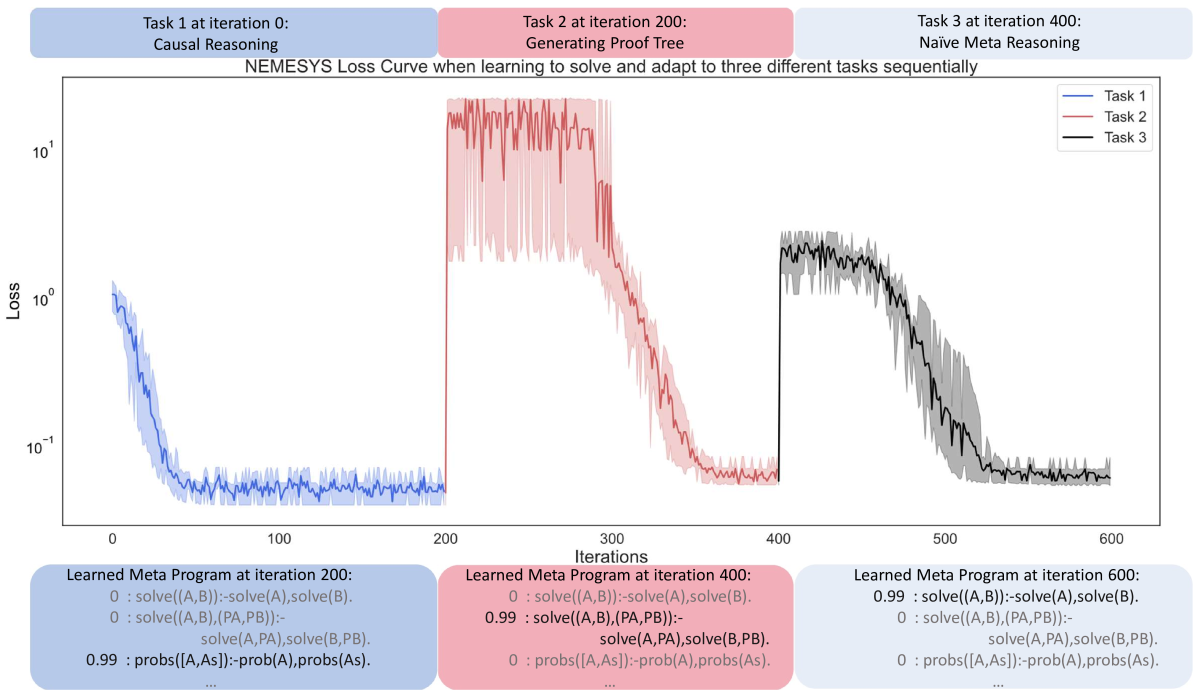
The image presents a loss curve illustrating the performance of the NEMESYS system as it learns to solve and adapt to three different tasks sequentially. The x-axis represents iterations, and the y-axis represents loss on a logarithmic scale. The plot shows three distinct phases, each corresponding to a different task: Causal Reasoning (Task 1), Generating Proof Tree (Task 2), and Naive Meta Reasoning (Task 3). The plot also includes learned meta programs at iterations 200, 400, and 600.
### Components/Axes
* **Title:** NEMESYS Loss Curve when learning to solve and adapt to three different tasks sequentially
* **X-axis:** Iterations, ranging from 0 to 600, with major ticks at 0, 100, 200, 300, 400, 500, and 600.
* **Y-axis:** Loss, on a logarithmic scale, ranging from 10<sup>-1</sup> to 10<sup>1</sup>, with major ticks at 10<sup>-1</sup>, 10<sup>0</sup>, and 10<sup>1</sup>.
* **Legend:** Located in the top-right corner.
* Task 1 (Blue)
* Task 2 (Red)
* Task 3 (Black)
* **Task Labels:**
* Task 1 at iteration 0: Causal Reasoning (Blue background)
* Task 2 at iteration 200: Generating Proof Tree (Red background)
* Task 3 at iteration 400: Naive Meta Reasoning (Pink background)
* **Learned Meta Programs:**
* Learned Meta Program at iteration 200 (Blue background)
* Learned Meta Program at iteration 400 (Red background)
* Learned Meta Program at iteration 600 (Blue background)
### Detailed Analysis
* **Task 1 (Blue):** Causal Reasoning. The loss decreases rapidly from approximately 10<sup>0</sup> at iteration 0 to approximately 10<sup>-1</sup> by iteration 100. The loss then stabilizes around 10<sup>-1</sup> for the remainder of the task's duration (until iteration 200).
* Learned Meta Program at iteration 200:
* `0 : solve((A,B)):-solve(A),solve(B).`
* `0 : solve((A,B),(PA,PB)):- solve(A,PA),solve(B,PB).`
* `0.99 : probs([A,As]):-prob(A),probs(As).`
* **Task 2 (Red):** Generating Proof Tree. The loss starts at approximately 10<sup>1</sup> at iteration 200 and decreases to approximately 10<sup>-1</sup> by iteration 400. The decrease is less rapid than in Task 1.
* Learned Meta Program at iteration 400:
* `0 : solve((A,B)):-solve(A),solve(B).`
* `0.99 : solve((A,B),(PA,PB)):- solve(A,PA),solve(B,PB).`
* `0 : probs([A,As]):-prob(A),probs(As).`
* **Task 3 (Black):** Naive Meta Reasoning. The loss starts at approximately 10<sup>0</sup> at iteration 400 and decreases to approximately 10<sup>-1</sup> by iteration 600. The decrease is relatively smooth.
* Learned Meta Program at iteration 600:
* `0.99 : solve((A,B)):-solve(A),solve(B).`
* `0 : solve((A,B),(PA,PB)):- solve(A,PA),solve(B,PB).`
* `0 : probs([A,As]):-prob(A),probs(As).`
### Key Observations
* Each task exhibits a decrease in loss over time, indicating learning.
* The initial loss for Task 2 is significantly higher than for Task 1, suggesting a more difficult initial state.
* The learned meta programs change over time, reflecting the adaptation to different tasks.
* The shaded regions around each line represent the variance or uncertainty in the loss values.
### Interpretation
The loss curve demonstrates the NEMESYS system's ability to learn and adapt to different tasks sequentially. The decreasing loss values indicate that the system is improving its performance on each task. The changes in the learned meta programs suggest that the system is modifying its internal representation to better suit the requirements of each task. The different initial loss values and learning rates for each task may reflect the varying complexity or difficulty of the tasks. The learned meta programs show the evolution of the system's reasoning rules as it progresses through the tasks. The system appears to be learning to solve problems more efficiently as it progresses through the tasks.