## Line Graph: NEMESYS Loss Curve when learning to solve and adapt to three different tasks sequentially
### Overview
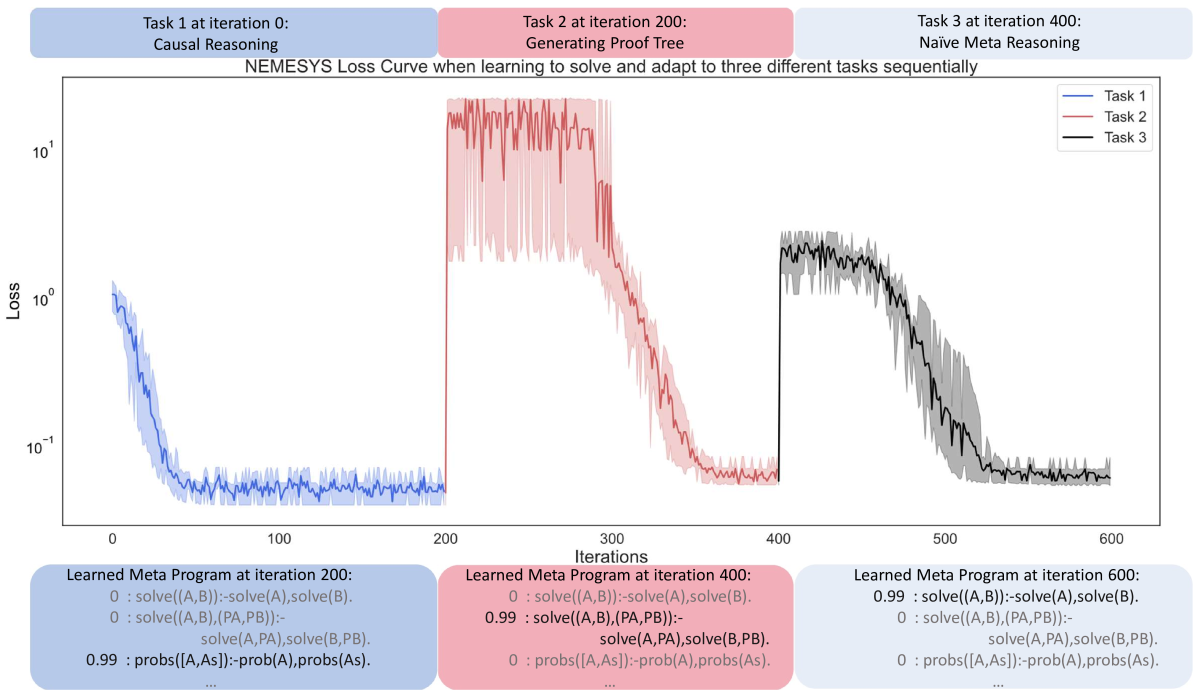
The graph depicts the loss curves for three sequential tasks (Task 1, Task 2, Task 3) across 600 training iterations. Loss is plotted on a logarithmic scale (10^-1 to 10^1), showing rapid initial improvement followed by stabilization. Each task is represented by a distinct color-coded line with corresponding shaded confidence intervals.
### Components/Axes
- **X-axis**: Iterations (0 to 600)
- **Y-axis**: Loss (log scale: 10^-1 to 10^1)
- **Legend**:
- Blue: Task 1 (Causal Reasoning)
- Red: Task 2 (Generating Proof Tree)
- Black: Task 3 (Naïve Meta Reasoning)
- **Text Boxes**:
- Bottom-left: Learned meta-program at iteration 200
- Bottom-center: Learned meta-program at iteration 400
- Bottom-right: Learned meta-program at iteration 600
### Detailed Analysis
1. **Task 1 (Blue Line)**:
- **Trend**: Sharp decline from ~10^0 to 10^-1 within first 100 iterations, then stabilizes with minor fluctuations.
- **Key Data Points**:
- Iteration 0: ~10^0
- Iteration 100: ~10^-1
- Iteration 200: ~10^-1 (confidence interval: ±10^-2)
2. **Task 2 (Red Line)**:
- **Trend**: Begins at iteration 200 with loss ~10^1, drops to ~10^-1 by iteration 400 with significant noise (confidence interval: ±10^-1).
- **Key Data Points**:
- Iteration 200: ~10^1
- Iteration 300: ~10^0
- Iteration 400: ~10^-1
3. **Task 3 (Black Line)**:
- **Trend**: Starts at iteration 400 with loss ~10^1, declines to ~10^-1 by iteration 600 with high volatility (confidence interval: ±10^-1).
- **Key Data Points**:
- Iteration 400: ~10^1
- Iteration 500: ~10^0
- Iteration 600: ~10^-1
### Key Observations
- **Sequential Learning**: Tasks are introduced at iterations 0, 200, and 400, with each new task starting with higher initial loss.
- **Noise Patterns**: Later tasks (Task 2/3) exhibit greater loss volatility, especially during early adaptation phases.
- **Meta-Program Evolution**:
- Iteration 200: Focus on solving (A,B) with probabilistic components
- Iteration 400: Increased emphasis on probabilistic reasoning (0.99 weight)
- Iteration 600: Balanced approach between solving and probabilistic operations
### Interpretation
The data demonstrates a multi-stage learning process where:
1. **Task 1** (Causal Reasoning) is rapidly mastered, achieving low loss quickly.
2. **Task 2** (Proof Tree Generation) requires more iterations to stabilize, suggesting greater complexity or novelty.
3. **Task 3** (Meta Reasoning) shows the most challenging adaptation, with persistent noise even after 200 iterations of dedicated training.
The meta-program evolution reveals a shift from deterministic solving operations to probabilistic reasoning as the model integrates new tasks. The increasing confidence interval width for later tasks indicates growing uncertainty during adaptation phases, consistent with the "catastrophic forgetting" phenomenon in sequential learning.
Notable anomalies include the abrupt loss spikes in Task 2/3 around iteration 300/500, potentially indicating model reconfiguration points where prior knowledge is temporarily disrupted during meta-learning updates.