## Image: 3D Model Rendering Quality Comparison
### Overview
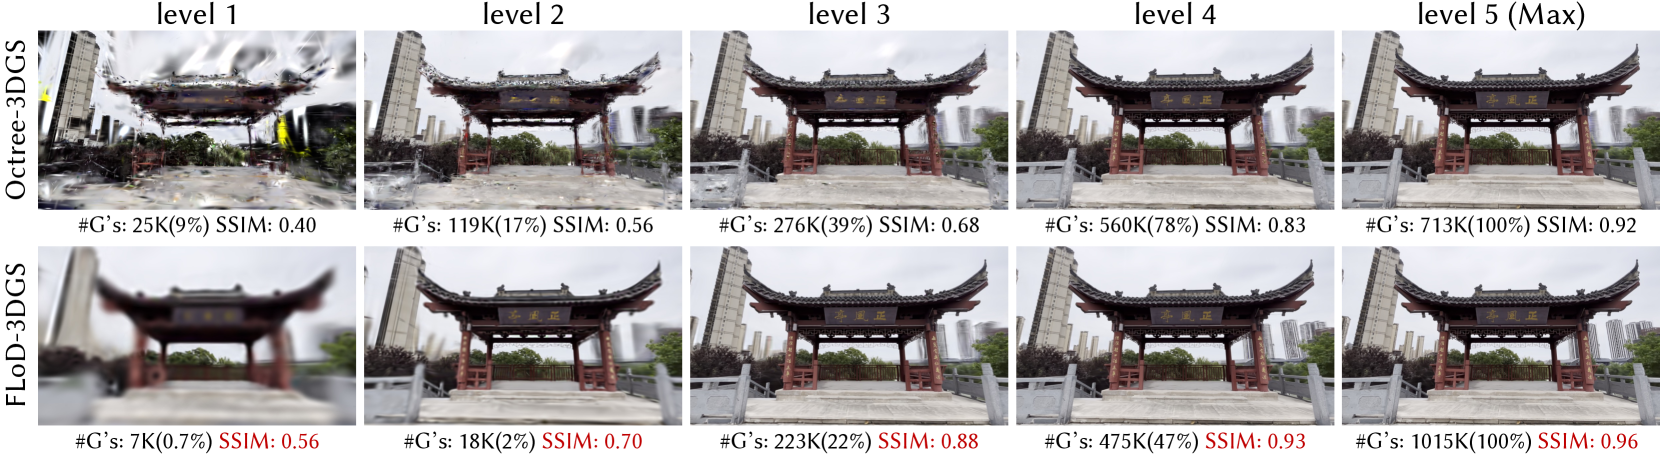
The image presents a comparison of rendering quality for a 3D model of a traditional Chinese pavilion, using two different techniques: Octree-3DGS and FLOD-3DGS. The rendering quality is shown at five different levels, ranging from Level 1 (lowest quality) to Level 5 (highest quality). Each rendering is accompanied by metrics: the number of graphics (G) used in kilobytes (K) and the Structural Similarity Index Measure (SSIM).
### Components/Axes
The image is organized into a 2x5 grid.
* **Rows:** Represent the rendering technique used: Octree-3DGS (top row) and FLOD-3DGS (bottom row).
* **Columns:** Represent the rendering level, labeled "level 1" through "level 5 (Max)".
* **Labels:** Each image has two labels below it: "#G s: [value]([percentage]) SSIM: [value]". "#G s:" indicates the number of graphics used in kilobytes, followed by the percentage of total graphics used. "SSIM:" indicates the Structural Similarity Index Measure, a metric for image quality.
### Detailed Analysis or Content Details
**Octree-3DGS:**
* **Level 1:** #G s: 25K(9%) SSIM: 0.40
* **Level 2:** #G s: 119K(17%) SSIM: 0.56
* **Level 3:** #G s: 276K(39%) SSIM: 0.68
* **Level 4:** #G s: 560K(78%) SSIM: 0.83
* **Level 5 (Max):** #G s: 713K(100%) SSIM: 0.92
**FLOD-3DGS:**
* **Level 1:** #G s: 7K(0.7%) SSIM: 0.56
* **Level 2:** #G s: 18K(2%) SSIM: 0.70
* **Level 3:** #G s: 223K(22%) SSIM: 0.88
* **Level 4:** #G s: 475K(47%) SSIM: 0.93
* **Level 5 (Max):** #G s: 1015K(100%) SSIM: 0.96
**Trends:**
* **Octree-3DGS:** As the level increases from 1 to 5, the number of graphics used (#G s) increases monotonically from 25K to 713K. The SSIM score also increases monotonically from 0.40 to 0.92, indicating improving image quality.
* **FLOD-3DGS:** Similar to Octree-3DGS, the number of graphics used (#G s) increases monotonically from 7K to 1015K as the level increases from 1 to 5. The SSIM score also increases monotonically from 0.56 to 0.96.
### Key Observations
* **Graphics Usage:** FLOD-3DGS consistently uses fewer graphics than Octree-3DGS at lower levels (1-3). However, at levels 4 and 5, the graphics usage for FLOD-3DGS approaches and exceeds that of Octree-3DGS.
* **SSIM Scores:** FLOD-3DGS achieves a higher SSIM score at all levels, suggesting better image quality for a given number of graphics, especially at lower levels.
* **Percentage of Graphics:** The percentage of graphics used increases with level for both methods, reaching 100% at level 5.
### Interpretation
The image demonstrates a trade-off between rendering quality (as measured by SSIM) and the number of graphics used. Both Octree-3DGS and FLOD-3DGS improve image quality as more graphics are utilized. However, FLOD-3DGS appears to be more efficient at lower levels, achieving comparable or better image quality with significantly fewer graphics. This suggests that FLOD-3DGS might be preferable for applications where computational resources are limited, or where a balance between quality and performance is desired. The increasing graphics usage at higher levels for both methods indicates diminishing returns in terms of SSIM improvement per additional graphic. The SSIM values suggest that the visual difference between levels 4 and 5 is less pronounced than between levels 1 and 2. The data suggests that FLOD-3DGS is a more efficient rendering technique, particularly at lower levels of detail, but requires more resources at the highest quality setting.