## Comparison Chart: Octree-3DGS vs. FLoD-3DGS Reconstruction Quality
### Overview
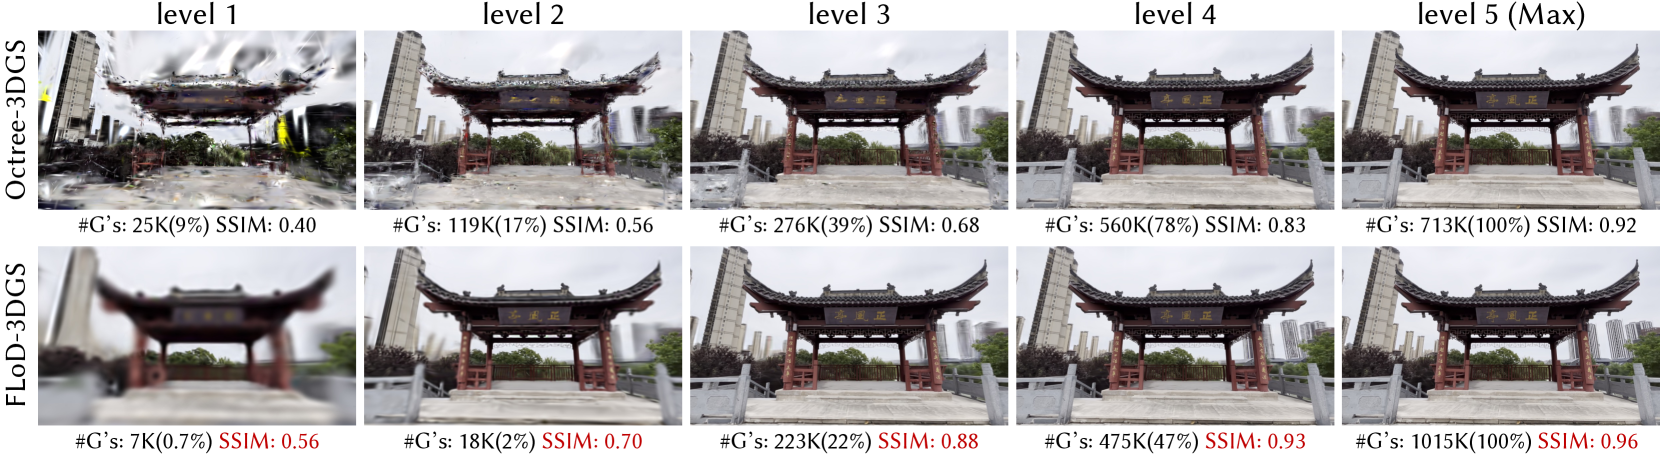
The image is a technical comparison chart demonstrating the progressive reconstruction quality of two 3D Gaussian Splatting (3DGS) methods—**Octree-3DGS** (top row) and **FLoD-3DGS** (bottom row)—across five increasing levels of detail (Level 1 to Level 5). Each panel shows a rendered view of the same scene: a traditional Chinese architectural gate (paifang) with modern buildings in the background. Below each image are quantitative metrics for the number of Gaussians (#G's) and the Structural Similarity Index Measure (SSIM).
### Components/Axes
* **Rows (Methods):**
* **Top Row:** Labeled vertically on the left as "Octree-3DGS".
* **Bottom Row:** Labeled vertically on the left as "FLoD-3DGS".
* **Columns (Levels):** Five columns, each labeled at the top: "level 1", "level 2", "level 3", "level 4", "level 5 (Max)".
* **Metrics per Panel:** Each of the 10 panels contains two lines of text below the image:
1. **#G's:** The number of Gaussian primitives used, followed by a percentage in parentheses (likely relative to the maximum for that method).
2. **SSIM:** The Structural Similarity Index Measure, a metric for image quality (1.0 = perfect match to reference).
### Detailed Analysis
**Row 1: Octree-3DGS**
* **Level 1:** Image is extremely blurry and distorted. Text: `#G's: 25K(9%) SSIM: 0.40`
* **Level 2:** Image is less blurry, major structures are discernible but lack detail. Text: `#G's: 119K(17%) SSIM: 0.56`
* **Level 3:** Image is clearer, details on the gate and background buildings are emerging. Text: `#G's: 276K(39%) SSIM: 0.68`
* **Level 4:** Image is quite clear, with good detail on the gate's roof and pillars. Text: `#G's: 560K(78%) SSIM: 0.83`
* **Level 5 (Max):** Image is sharp and detailed. Text: `#G's: 713K(100%) SSIM: 0.92`
**Row 2: FLoD-3DGS**
* **Level 1:** Image is blurry but shows more coherent structure than Octree-3DGS at the same level. Text: `#G's: 7K(0.7%) SSIM: 0.56`
* **Level 2:** Image is significantly clearer than Octree-3DGS Level 2. Text: `#G's: 18K(2%) SSIM: 0.70`
* **Level 3:** Image is already very clear, comparable to Octree-3DGS Level 4. Text: `#G's: 223K(22%) SSIM: 0.88`
* **Level 4:** Image is very sharp. Text: `#G's: 475K(47%) SSIM: 0.93`
* **Level 5 (Max):** Image is extremely sharp and detailed. Text: `#G's: 1015K(100%) SSIM: 0.96`
**Embedded Text in Images:** The gate itself has a plaque with Chinese characters. The characters are partially legible in the higher-quality reconstructions (e.g., FLoD-3DGS Level 5). They appear to read "XX區" (the first two characters are less clear, possibly "XX District" or a name).
### Key Observations
1. **Efficiency vs. Quality Trade-off:** FLoD-3DGS achieves significantly higher SSIM scores at every corresponding level while using a vastly lower percentage of its total Gaussians. For example, at Level 3, FLoD uses 22% of its Gaussians for an SSIM of 0.88, while Octree uses 39% for an SSIM of 0.68.
2. **Visual Quality Progression:** Both methods show a clear trend of improving visual fidelity (less blur, more detail) as the level increases. However, FLoD-3DGS starts at a much higher baseline quality (SSIM 0.56 at Level 1 vs. Octree's 0.40).
3. **Resource Allocation:** The maximum resource usage (#G's at 100%) differs greatly: Octree-3DGS uses 713K Gaussians, while FLoD-3DGS uses 1015K. This suggests FLoD may have a higher ceiling for detail but is far more efficient in reaching acceptable quality earlier.
4. **Anomaly/Notable Point:** The SSIM for FLoD-3DGS at Level 1 (0.56) is equal to Octree-3DGS at Level 2, indicating FLoD's coarsest representation is as structurally similar to the reference as Octree's second-coarsest.
### Interpretation
This chart is a performance benchmark for novel view synthesis techniques. It demonstrates that the **FLoD-3DGS method is substantially more efficient than Octree-3DGS** in terms of the quality-to-resource ratio. The data suggests FLoD employs a more effective level-of-detail (LoD) strategy, allocating Gaussian primitives in a way that captures essential scene structure much earlier in the refinement process.
The **Peircean investigative reading** reveals the underlying claim: FLoD-3DGS is not just incrementally better, but represents a qualitative leap in efficiency. The steep SSIM improvement curve for FLoD (0.56 → 0.96) compared to Octree (0.40 → 0.92) indicates its progressive refinement is better aligned with human visual perception and structural fidelity. The fact that FLoD's Level 3 (22% resources) nearly matches Octree's Level 5 (100% resources) in SSIM (0.88 vs. 0.92) is a powerful argument for its practical utility in applications where computational resources or bandwidth are constrained, such as real-time rendering or streaming 3D content. The chart effectively argues that FLoD-3DGS provides a better user experience (higher quality) at lower cost (fewer Gaussians needed for a given quality target).