\n
## Chart: STFT and SNR vs. Percentage of Binaural Audios
### Overview
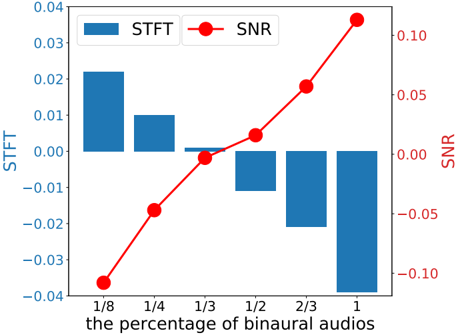
The image presents a combined bar and line chart illustrating the relationship between the Short-Time Fourier Transform (STFT) and Signal-to-Noise Ratio (SNR) as a function of the percentage of binaural audios. The chart displays STFT values as blue bars and SNR values as a red line with circular markers. A secondary y-axis on the right side of the chart displays the SNR scale.
### Components/Axes
* **X-axis:** "the percentage of binaural audios" with markers at 1/8, 1/4, 1/3, 1/2, 2/3, and 1.
* **Left Y-axis:** "STFT" with a scale ranging from -0.04 to 0.04.
* **Right Y-axis:** "SNR" with a scale ranging from -0.10 to 0.10.
* **Legend:** Located in the top-left corner, identifying the blue bars as "STFT" and the red line with circles as "SNR".
* **Data Series:**
* STFT (Blue Bars)
* SNR (Red Line with Circles)
### Detailed Analysis
**STFT (Blue Bars):**
The STFT values generally decrease as the percentage of binaural audios increases.
* At 1/8: Approximately 0.023.
* At 1/4: Approximately 0.011.
* At 1/3: Approximately 0.001.
* At 1/2: Approximately -0.004.
* At 2/3: Approximately -0.008.
* At 1: Approximately -0.002.
**SNR (Red Line with Circles):**
The SNR values increase as the percentage of binaural audios increases. The line exhibits a curved, upward trend.
* At 1/8: Approximately -0.035.
* At 1/4: Approximately -0.020.
* At 1/3: Approximately -0.005.
* At 1/2: Approximately 0.010.
* At 2/3: Approximately 0.030.
* At 1: Approximately 0.085.
### Key Observations
* There is an inverse relationship between STFT and SNR. As STFT decreases, SNR increases.
* The SNR shows a more pronounced increase between 1/2 and 2/3 of the binaural audios.
* The STFT values become negative after 1/3 of the binaural audios, indicating a shift in the signal characteristics.
### Interpretation
The chart suggests that increasing the percentage of binaural audios improves the signal-to-noise ratio (SNR) while simultaneously decreasing the Short-Time Fourier Transform (STFT) value. This could indicate that the addition of binaural information enhances the clarity of the signal (higher SNR) but potentially reduces the complexity or magnitude of the frequency components captured by the STFT. The negative STFT values at higher percentages of binaural audios might signify a phase shift or a change in the signal's spectral distribution. The data suggests a trade-off between signal complexity (as measured by STFT) and signal clarity (as measured by SNR) when incorporating binaural audio. The steep increase in SNR between 1/2 and 2/3 suggests a threshold effect where adding more binaural information yields a disproportionately large improvement in signal quality.