\n
## Diagram: Reinforcement Learning Training Pipeline with Failure Analysis
### Overview
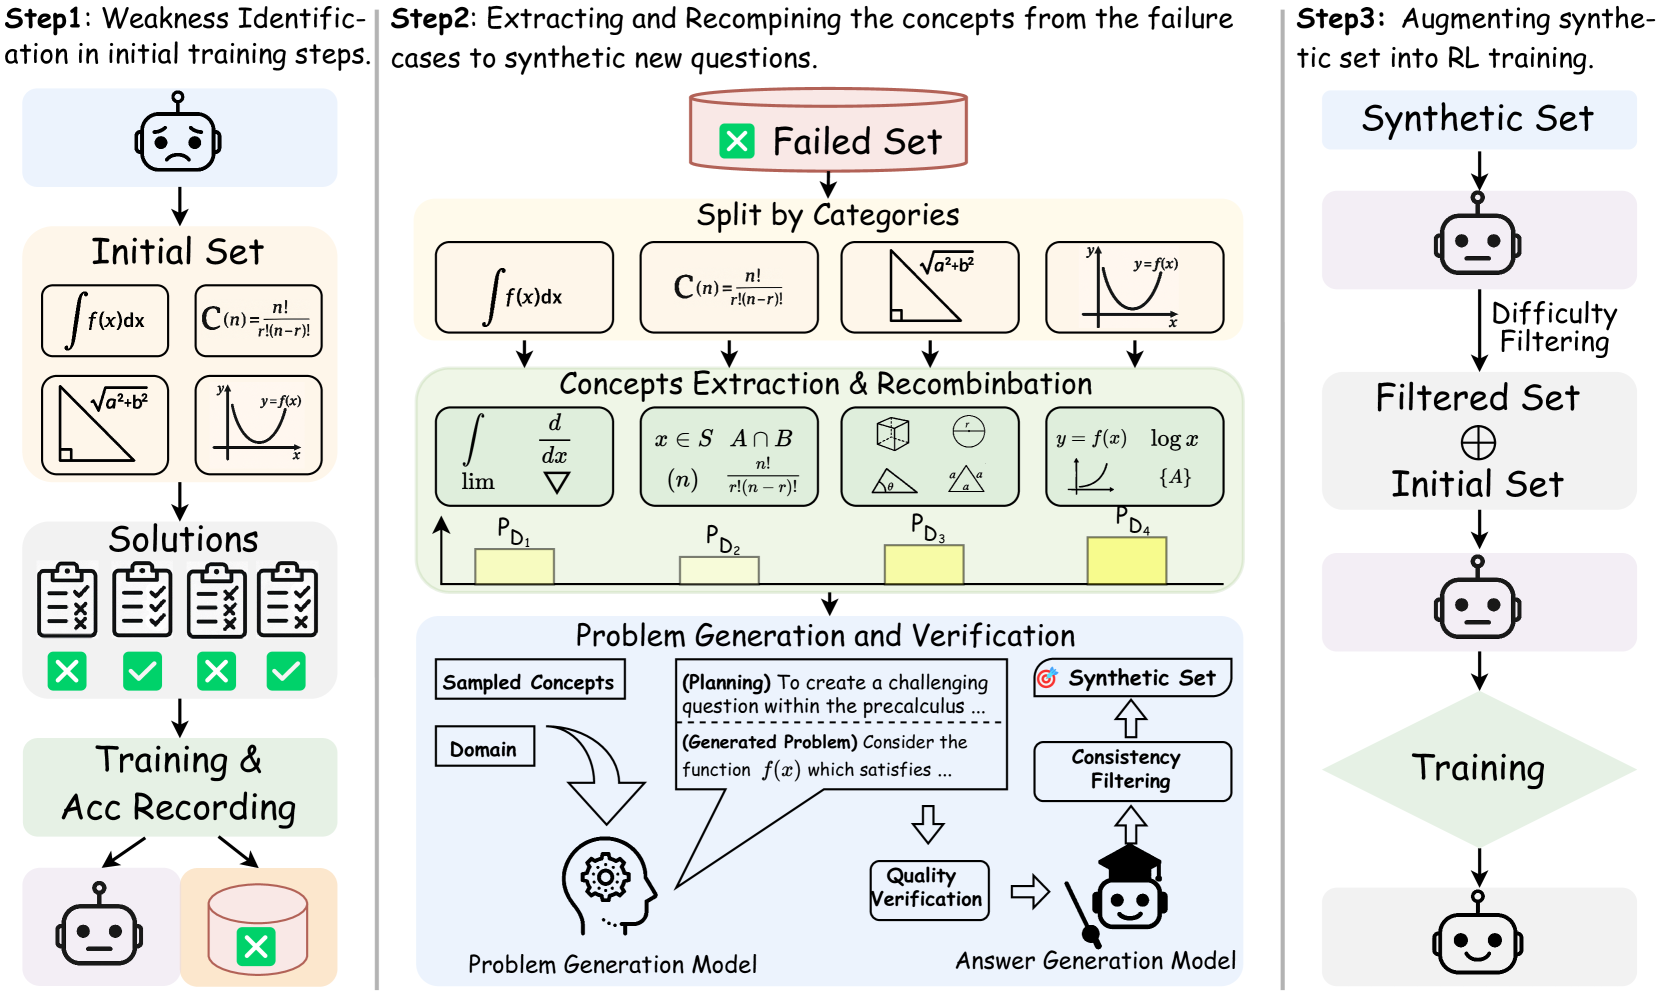
This diagram illustrates a reinforcement learning (RL) training pipeline that incorporates failure analysis and recombination of concepts to improve the synthetic set used for training. The process is divided into three main steps: Weakness Identification, Extracting and Recombining concepts from failures, and Augmenting synthetic set into RL training. It shows how failed cases are analyzed, broken down into concepts, recombined, and used to generate new training data.
### Components/Axes
The diagram is structured into three main columns representing the three steps. Key components include:
* **Initial Set:** Represents the starting point of the training data.
* **Failed Set:** Represents the subset of training cases that resulted in failure.
* **Synthetic Set:** Represents the artificially generated training data.
* **Filtered Set:** Represents the synthetic set after difficulty filtering.
* **Solutions:** Represents the correct answers or solutions to the training problems.
* **Concepts Extraction & Recombination:** A central block representing the process of analyzing failed cases and recombining concepts.
* **Problem Generation & Verification:** A block representing the generation of new training problems and their verification.
* **Training & Acc Recording:** A block representing the training process and the recording of accuracy.
* **Difficulty Filtering:** A process to filter the synthetic set based on difficulty.
* **Consistency Filtering:** A process to filter the synthetic set based on consistency.
* **Quality Verification:** A process to verify the quality of generated problems.
* **Domain:** Represents the knowledge domain for problem generation.
* **Problem Generation Model:** A model used to generate new problems.
* **Answer Generation Model:** A model used to generate answers to the problems.
### Detailed Analysis or Content Details
**Step 1: Weakness Identification in initial training steps.**
* An image of a sad robot face represents the initial state.
* The "Initial Set" contains mathematical expressions:
* ∫f(x)dx
* C(n) = n! / (n-r)!
* √a² + b²
* y = f(x)
* "Solutions" are represented by a stack of papers with checkmarks and crosses, indicating correct and incorrect solutions.
**Step 2: Extracting and Recombining the concepts from the failure cases to synthetic new questions.**
* "Failed Set" is indicated by a red 'X' symbol.
* "Split by Categories" leads to four distinct concept groups, each represented by a mathematical expression:
* ∫f(x)dx, C(n) = n! / (n-r)!
* d/dx, x ∈ S ∧ B
* lim, ∇
* y = f(x), log a
* "Concepts Extraction & Recombination" is represented by a block containing mathematical symbols (∫, d/dx, lim, ∇, x ∈ S ∧ B, n!, y = f(x), log a, {A}).
* The recombination process is represented by four probability distributions: P<sub>D1</sub>, P<sub>D2</sub>, P<sub>D3</sub>, P<sub>D4</sub>.
* "Problem Generation & Verification" includes:
* "Sampled Concepts" linked to "Domain" (represented by a gear icon).
* "(Planning) To create a challenging question within the precalculus..."
* "(Generated Problem) Consider the function f(x) which satisfies..."
* "Quality Verification" and "Answer Generation Model" (robot face).
**Step 3: Augmenting synthetic set into RL training.**
* A robot face represents the synthetic set generation.
* "Difficulty Filtering" filters the "Synthetic Set".
* "Filtered Set" is combined with the "Initial Set".
* A robot face represents the training process.
* "Training & Acc Recording" is represented by a robot face with a checkmark.
### Key Observations
* The diagram emphasizes a cyclical process of training, failure analysis, and improvement.
* Mathematical expressions are central to the training data and failure analysis.
* The recombination of concepts is a key step in generating new training data.
* Filtering mechanisms (difficulty and consistency) are used to refine the synthetic set.
* The use of robot faces throughout the diagram suggests an automated training process.
### Interpretation
The diagram depicts a sophisticated reinforcement learning training methodology that actively addresses weaknesses in the initial training data. By analyzing failed cases, extracting underlying concepts, and recombining them to generate new training examples, the system aims to improve its performance and robustness. The inclusion of filtering steps suggests a focus on creating high-quality synthetic data that is both challenging and consistent. The cyclical nature of the process indicates a continuous learning loop, where failures are used as opportunities for improvement. The diagram highlights the importance of not only generating synthetic data but also of intelligently analyzing and refining it based on the system's performance. The use of mathematical expressions suggests that the system is being trained on a task involving mathematical reasoning or problem-solving. The overall design suggests a system that is designed to learn from its mistakes and adapt to new challenges.