TECHNICAL ASSET FINGERPRINT
1799267972d80f2674a0acb7
Click to view fullscreen
Press ESC or click to close
FOUND IN PAPERS
EXPERT: healer-alpha-free VERSION 1
RUNTIME: free/openrouter/healer-alpha
INTEL_VERIFIED
## Diagram: Three-Step Process for Improving AI Model Training via Synthetic Data Generation
### Overview
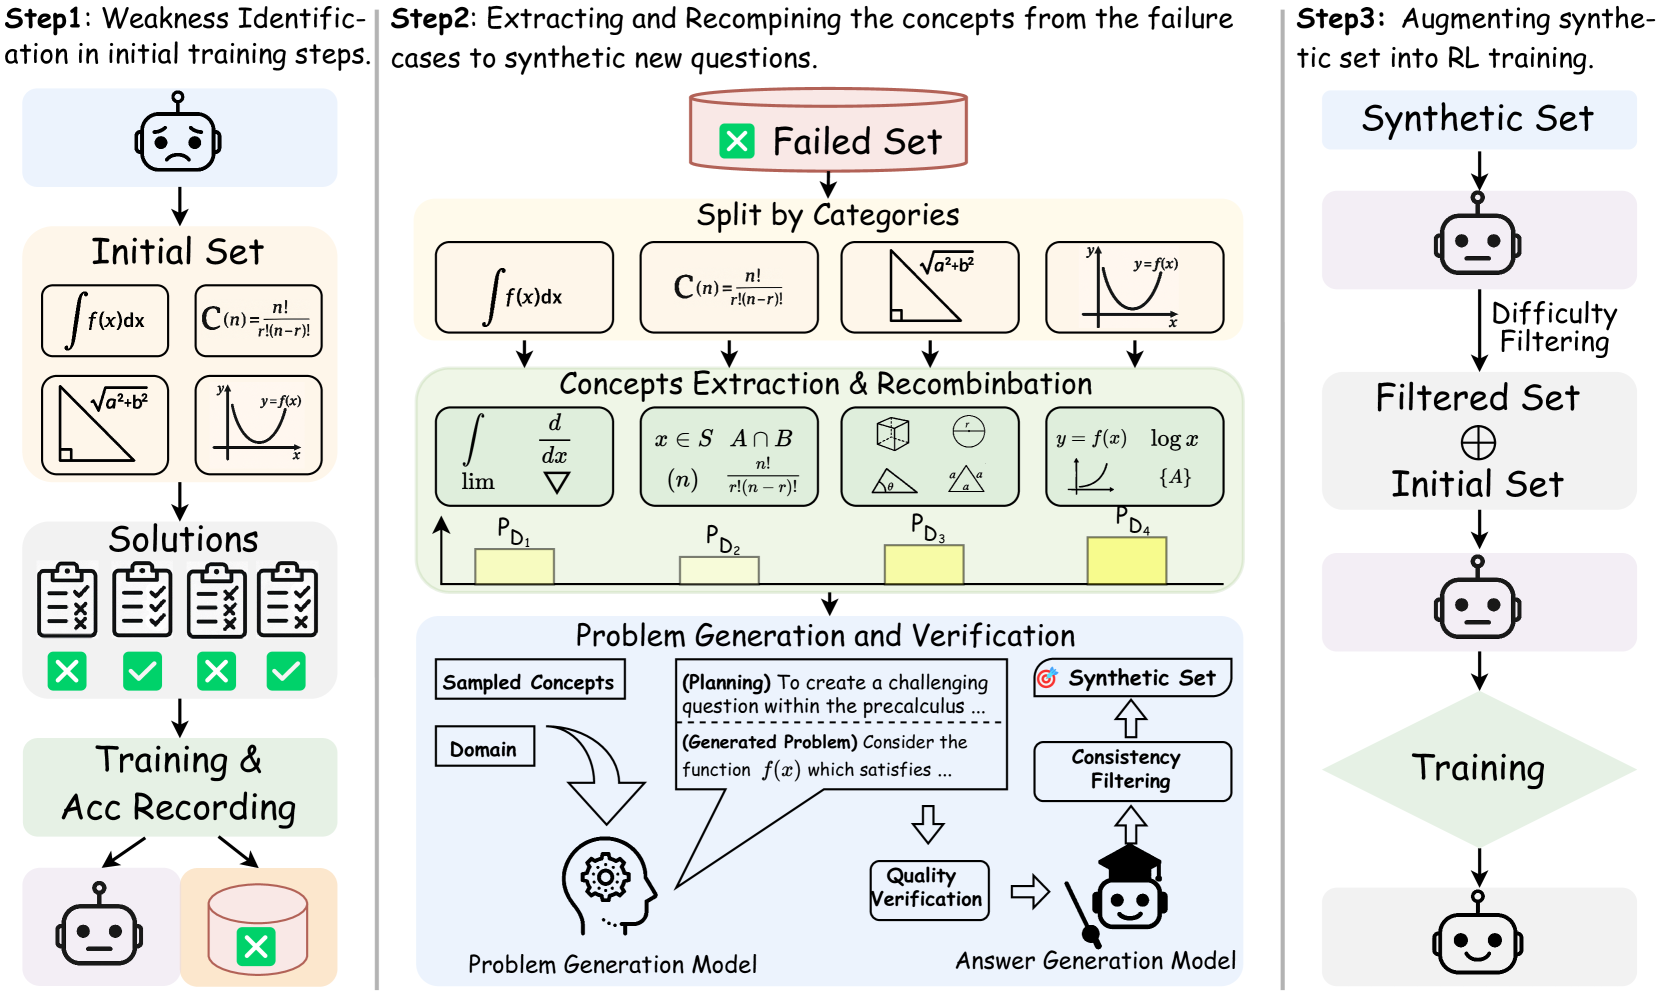
The image is a technical process diagram illustrating a three-step methodology for enhancing an AI model's training. The process focuses on identifying weaknesses in the model's initial performance, using those failures to generate new synthetic training questions, and then integrating this synthetic data back into the training pipeline. The diagram uses icons, mathematical notation, flow arrows, and text labels to explain each stage.
### Components/Axes
The diagram is divided into three vertical panels, each representing a major step.
**Step 1 (Left Panel): Weakness Identification in initial training steps.**
* **Top Icon:** A robot head with a neutral/slightly concerned expression.
* **Initial Set:** A box containing four mathematical problem examples:
1. Integral notation: `∫ f(x) dx`
2. Combination formula: `C(n) = n! / (r!(n-r)!)`
3. Pythagorean theorem diagram: A right triangle with sides labeled `a`, `b`, and hypotenuse `√(a²+b²)`.
4. Function graph: A coordinate system with a curve labeled `y = f(x)`.
* **Solutions:** Four clipboard icons, each with a checklist. Below them are status indicators: a green checkmark (✓), a red cross (✗), a green checkmark (✓), and a green checkmark (✓). This indicates mixed success on the initial problems.
* **Training & Acc Recording:** A box leading to two outputs:
1. A robot head icon (the trained model).
2. A database/cylinder icon with a red cross (✗) overlay, labeled as the "Failed Set" in the next step.
**Step 2 (Center Panel): Extracting and Recombining the concepts from the failure cases to synthetic new questions.**
* **Failed Set:** A red-bordered box at the top, containing a red cross (✗) icon and the text "Failed Set". An arrow points down from the database in Step 1.
* **Split by Categories:** The failed problems are categorized into four boxes, mirroring the initial set:
1. `∫ f(x) dx`
2. `C(n) = n! / (r!(n-r)!)`
3. The Pythagorean theorem triangle.
4. The `y = f(x)` graph.
* **Concepts Extraction & Recombination:** A green-shaded box showing how core concepts are extracted and mixed. It contains four sub-boxes with new mathematical expressions:
1. `∫`, `d/dx`, `lim`, `∇` (integral, derivative, limit, gradient symbols).
2. `x ∈ S`, `A ∩ B`, `(n)`, `n! / (r!(n-r)!)` (set membership, intersection, combination notation).
3. Geometric shapes: a cube, a circle with radius `r`, and two triangles with angles labeled `θ` and `a`.
4. `y = f(x)`, `log x`, a graph of a logarithmic curve, `{A}`.
* **Probability Bars:** Below the recombination box are four yellow bars of varying heights, labeled `P_D1`, `P_D2`, `P_D3`, and `P_D4` from left to right. These likely represent the probability or weight of sampling from each concept domain.
* **Problem Generation and Verification:** A blue-shaded box at the bottom.
* **Inputs:** "Sampled Concepts" and "Domain" feed into a "Problem Generation Model" (icon: a head with gears).
* **Process Text:** A speech bubble from the model contains:
* `(Planning) To create a challenging question within the precalculus ...`
* `(Generated Problem) Consider the function f(x) which satisfies ...`
* **Verification Flow:** The generated problem goes to "Quality Verification" (icon: a document with a checkmark), then to an "Answer Generation Model" (icon: a robot with a graduation cap). This model performs "Consistency Filtering" and outputs to the "Synthetic Set" (icon: a target with an arrow).
**Step 3 (Right Panel): Augmenting synthetic set into RL training.**
* **Synthetic Set:** A box at the top, receiving output from Step 2.
* **Flow:** An arrow points down to a robot head icon, then through a process labeled "Difficulty Filtering".
* **Filtered Set ⊕ Initial Set:** The filtered synthetic data is combined (⊕ symbol) with the original "Initial Set".
* **Training:** The combined dataset is used for "Training" (represented by a green diamond shape).
* **Final Output:** An arrow points down to a final robot head icon with a happy/smiling expression, indicating the improved model.
### Detailed Analysis
The diagram details a closed-loop, iterative training improvement cycle.
1. **Weakness Identification:** The model is tested on an initial set of problems (calculus, combinatorics, geometry, functions). Its failures are recorded.
2. **Concept-Based Synthesis:** Instead of simply repeating failed problems, the system decomposes them into fundamental mathematical concepts (e.g., integration, combinatorics, geometric relations, function properties). These concepts are then recombined to create novel problem structures.
3. **Controlled Generation & Filtering:** A dedicated model generates new problems based on sampled concepts and domain. These undergo quality and consistency checks. The resulting synthetic set is then filtered by difficulty before being merged with the original training data.
4. **Reinforcement Learning (RL) Integration:** The augmented dataset (original + high-quality synthetic problems) is used in a subsequent training phase (likely RL, as mentioned in the step title), leading to a more robust model.
### Key Observations
* **Visual Coding:** Colors are used meaningfully: red for failure/initial problems, green for success/recombination, blue for the generation process. The robot's expression changes from neutral/concerned (Step 1) to happy (Step 3), visually signaling improvement.
* **Mathematical Specificity:** The diagram is not abstract; it uses concrete examples from pre-calculus and calculus (integrals, combinations, Pythagoras, functions, logs) to ground the process.
* **Process Granularity:** Step 2 is the most detailed, highlighting that the core innovation lies in the concept extraction, recombination, and verified generation of new problems, not just data augmentation.
* **Uncertainty in Quantification:** The yellow bars (`P_D1` to `P_D4`) indicate that the sampling of concepts is probabilistic, but their exact numerical values or the criteria for their heights are not provided in the image.
### Interpretation
This diagram outlines a sophisticated methodology for addressing a core challenge in AI training: data scarcity and the "long tail" of rare or difficult cases. The process is **Peircean** in its investigative logic:
* **Abduction:** It starts by *observing* failures (the "Failed Set") and *inferring* the underlying conceptual weaknesses (the "Split by Categories").
* **Deduction:** It then *hypothesizes* that creating new problems from these recombined concepts will challenge the model in targeted ways. The "Planning" and "Generated Problem" text shows this deductive reasoning in action.
* **Induction:** Finally, it *tests* this hypothesis by generating, filtering, and integrating the synthetic data, then retraining the model. The improved model (happy robot) is the inductive conclusion that the method works.
The system moves beyond simple error repetition. By decomposing failures into atomic concepts and recombining them, it can generate a potentially infinite variety of novel problems that probe the same conceptual gaps. This makes the training more efficient and the resulting model more generalizable. The emphasis on "Verification" and "Filtering" is crucial, as it ensures the synthetic data is high-quality and pedagogically useful, preventing the model from learning from flawed or trivial examples. The ultimate goal is a form of **curriculum learning** where the model's own weaknesses dictate the generation of its next set of training challenges.
DECODING INTELLIGENCE...