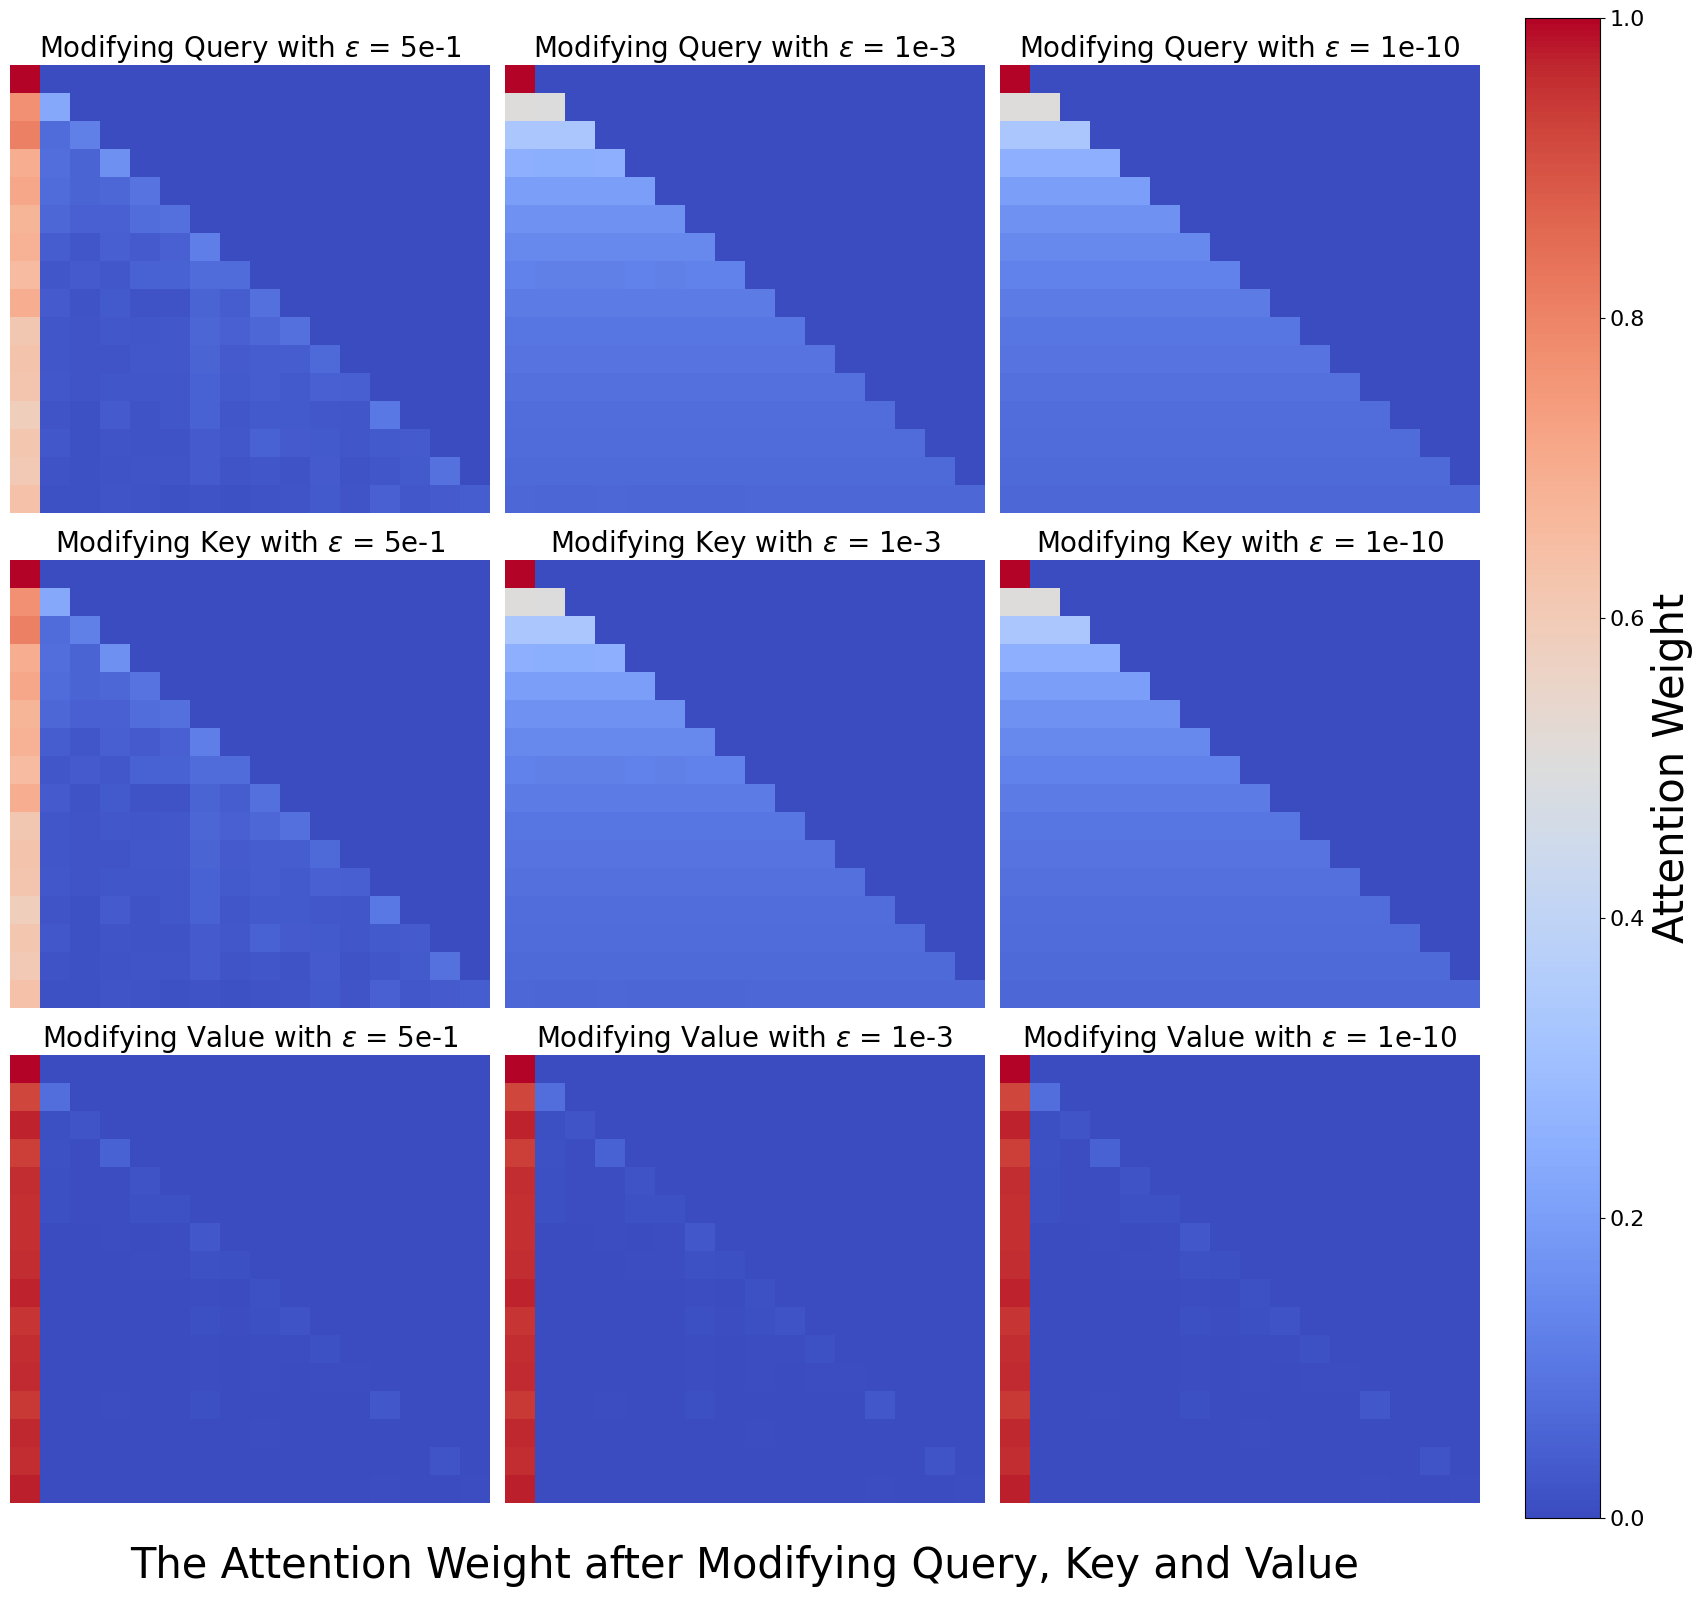
## Heatmap Grid: Attention Weight Modification
### Overview
The image presents a 3x3 grid of heatmaps visualizing the attention weight after modifying the Query, Key, and Value components of a model. Each row represents a different component being modified (Query, Key, Value), and each column represents a different value of epsilon (ɛ = 5e-1, 1e-3, 1e-10). The heatmaps display the attention weights, with color intensity ranging from blue (low weight) to red (high weight), as indicated by the colorbar on the right.
### Components/Axes
* **Title:** "The Attention Weight after Modifying Query, Key and Value"
* **Colorbar (Right):**
* Label: "Attention Weight"
* Scale: 0.0 to 1.0, incrementing by 0.2.
* **Rows (Top to Bottom):**
* Row 1: "Modifying Query with ɛ = 5e-1", "Modifying Query with ɛ = 1e-3", "Modifying Query with ɛ = 1e-10"
* Row 2: "Modifying Key with ɛ = 5e-1", "Modifying Key with ɛ = 1e-3", "Modifying Key with ɛ = 1e-10"
* Row 3: "Modifying Value with ɛ = 5e-1", "Modifying Value with ɛ = 1e-3", "Modifying Value with ɛ = 1e-10"
### Detailed Analysis
Each heatmap is a square matrix, presumably representing the attention weights between different elements.
* **Modifying Query:**
* ɛ = 5e-1: The attention weights are distributed across the matrix, with higher weights along the first column and the diagonal.
* ɛ = 1e-3: The attention weights are concentrated in the top-left corner, decreasing towards the bottom-right.
* ɛ = 1e-10: The attention weights are even more concentrated in the top-left corner, with a sharper decrease towards the bottom-right.
* **Modifying Key:**
* ɛ = 5e-1: Similar to modifying the query, the attention weights are distributed, but with a stronger emphasis on the first column.
* ɛ = 1e-3: The attention weights are concentrated in the top-left corner, decreasing towards the bottom-right.
* ɛ = 1e-10: The attention weights are highly concentrated in the top-left corner.
* **Modifying Value:**
* ɛ = 5e-1: The attention weights are primarily concentrated in the first column.
* ɛ = 1e-3: The attention weights are almost exclusively concentrated in the first column.
* ɛ = 1e-10: The attention weights are almost exclusively concentrated in the first column.
### Key Observations
* As epsilon (ɛ) decreases (5e-1 to 1e-10), the attention weights become more concentrated.
* Modifying the Value component results in a strong focus on the first column, regardless of the epsilon value.
* Modifying the Query and Key components show a transition from distributed attention weights to concentrated attention weights in the top-left corner as epsilon decreases.
### Interpretation
The heatmaps illustrate how different modifications to the Query, Key, and Value components, controlled by the epsilon parameter, affect the attention weights within a model. The concentration of attention weights in the top-left corner or the first column suggests that certain elements are becoming more dominant in the attention mechanism as epsilon decreases. This could indicate that the model is becoming more selective in its attention, focusing on specific features or elements. The behavior when modifying the Value component suggests that the value representation plays a crucial role in directing attention towards the initial elements. The parameter epsilon (ɛ) seems to control the "sharpness" or focus of the attention mechanism.