\n
## Line Chart: Levels Solved vs. Steps
### Overview
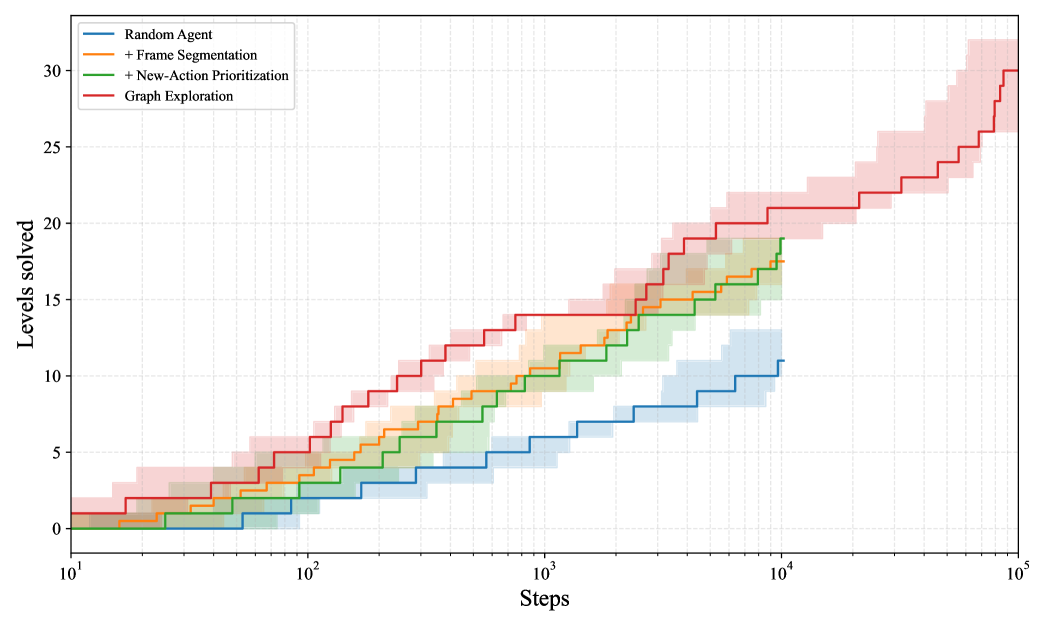
The image presents a line chart illustrating the relationship between the number of steps taken and the number of levels solved by different agents. The chart compares the performance of a "Random Agent" with agents employing various enhancements: "+ Frame Segmentation", "+ New-Action Prioritization", and "Graph Exploration". Each line represents the average performance of an agent type, with shaded areas indicating the standard deviation or confidence interval. The x-axis is logarithmic.
### Components/Axes
* **X-axis:** "Steps" - Logarithmic scale ranging from 10<sup>1</sup> to 10<sup>5</sup>.
* **Y-axis:** "Levels solved" - Linear scale ranging from 0 to 32.
* **Legend:** Located at the top-left corner of the chart.
* "Random Agent" - Blue line
* "+ Frame Segmentation" - Yellow-Green line
* "+ New-Action Prioritization" - Orange line
* "Graph Exploration" - Red line
### Detailed Analysis
The chart displays four lines, each representing a different agent type. The lines show the average number of levels solved as a function of the number of steps taken. The shaded areas around each line represent the variability in performance.
* **Random Agent (Blue):** The line starts at approximately 0 levels solved at 10<sup>1</sup> steps and gradually increases to approximately 11 levels solved at 10<sup>5</sup> steps. The line exhibits a relatively slow and steady upward slope.
* **+ Frame Segmentation (Yellow-Green):** The line begins at approximately 0 levels solved at 10<sup>1</sup> steps and rises more steeply than the Random Agent, reaching approximately 18 levels solved at 10<sup>5</sup> steps.
* **+ New-Action Prioritization (Orange):** This line starts at approximately 0 levels solved at 10<sup>1</sup> steps and shows a steeper increase than the Random Agent and + Frame Segmentation, reaching approximately 24 levels solved at 10<sup>5</sup> steps.
* **Graph Exploration (Red):** This line demonstrates the most rapid increase, starting at approximately 0 levels solved at 10<sup>1</sup> steps and reaching approximately 31 levels solved at 10<sup>5</sup> steps.
**Approximate Data Points (extracted visually):**
| Steps (approx.) | Random Agent (Levels Solved) | + Frame Segmentation (Levels Solved) | + New-Action Prioritization (Levels Solved) | Graph Exploration (Levels Solved) |
|---|---|---|---|---|
| 10<sup>1</sup> | 0 | 0 | 0 | 0 |
| 10<sup>2</sup> | 2 | 4 | 6 | 8 |
| 10<sup>3</sup> | 6 | 10 | 14 | 18 |
| 10<sup>4</sup> | 9 | 16 | 22 | 28 |
| 10<sup>5</sup> | 11 | 18 | 24 | 31 |
### Key Observations
* The "Graph Exploration" agent consistently outperforms all other agents across the entire range of steps.
* "+ New-Action Prioritization" performs better than "+ Frame Segmentation", which in turn performs better than the "Random Agent".
* The performance gains are most significant at higher step counts.
* The shaded areas indicate that the "Graph Exploration" agent has the lowest variability in performance, while the "Random Agent" has the highest.
### Interpretation
The data suggests that incorporating graph exploration techniques significantly improves an agent's ability to solve levels, as evidenced by its consistently higher performance compared to other agents. The enhancements of frame segmentation and new-action prioritization also contribute to improved performance, but to a lesser extent than graph exploration. The logarithmic scale of the x-axis highlights the increasing effectiveness of these techniques as the number of steps increases, indicating that they are particularly beneficial for complex tasks requiring long-term planning and exploration. The variability in performance, as indicated by the shaded areas, suggests that the "Random Agent" is more susceptible to random fluctuations, while the "Graph Exploration" agent exhibits more consistent and reliable performance. This could be due to the more structured and informed decision-making process enabled by graph exploration. The chart demonstrates a clear hierarchy of effectiveness among the different agent strategies, with graph exploration emerging as the most promising approach.