## Line Chart: Performance of Different AI Agents in Level Solving Over Time
### Overview
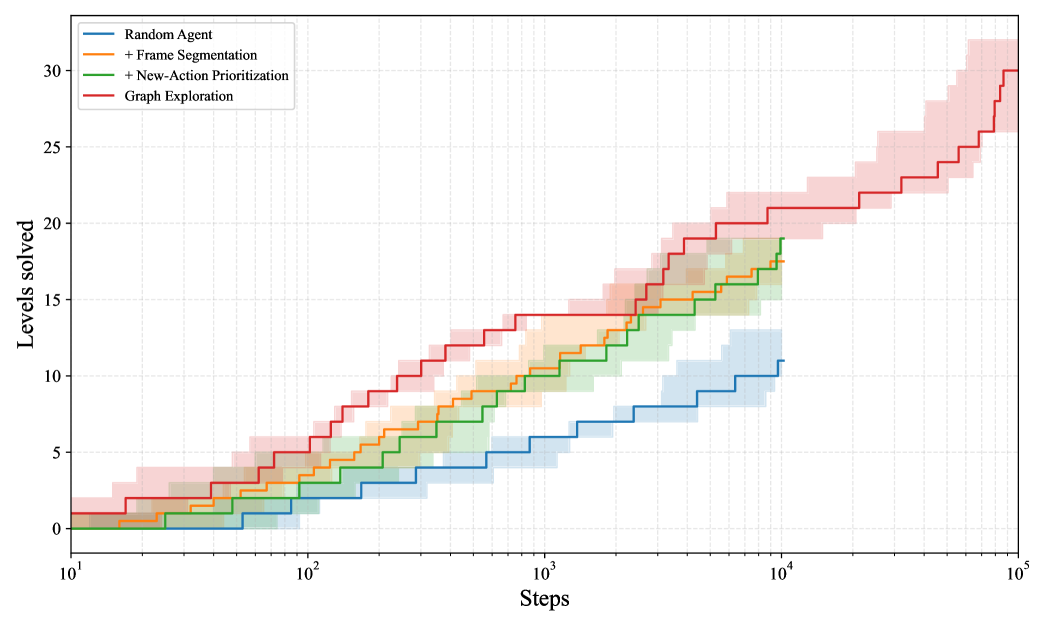
The image displays a line chart comparing the performance of four different AI agent strategies in solving levels over a number of steps. The chart uses a logarithmic scale for the x-axis (Steps) and a linear scale for the y-axis (Levels solved). Each strategy is represented by a colored line with a corresponding shaded area, likely indicating confidence intervals or variance across multiple runs.
### Components/Axes
* **Chart Type:** Line chart with shaded confidence bands.
* **X-Axis:**
* **Label:** "Steps"
* **Scale:** Logarithmic (base 10).
* **Major Tick Marks:** 10¹, 10², 10³, 10⁴, 10⁵.
* **Y-Axis:**
* **Label:** "Levels solved"
* **Scale:** Linear.
* **Range:** 0 to 30.
* **Major Tick Marks:** 0, 5, 10, 15, 20, 25, 30.
* **Legend:**
* **Position:** Top-left corner of the chart area.
* **Entries (from top to bottom):**
1. **Blue Line:** "Random Agent"
2. **Orange Line:** "+ Frame Segmentation"
3. **Green Line:** "+ New-Action Prioritization"
4. **Red Line:** "Graph Exploration"
* **Data Series:** Four distinct lines, each with a shaded band of the same color but lower opacity.
### Detailed Analysis
**Trend Verification & Data Point Extraction (Approximate Values):**
1. **Random Agent (Blue Line & Band):**
* **Trend:** Shows the slowest, most gradual upward slope. It begins near 0 levels solved and increases in a step-like fashion.
* **Key Points:**
* At ~10² steps: ~1 level solved.
* At ~10³ steps: ~5 levels solved.
* At ~10⁴ steps: ~10 levels solved.
* The line terminates at 10⁴ steps. The shaded blue band extends slightly above and below the line, indicating variance.
2. **+ Frame Segmentation (Orange Line & Band):**
* **Trend:** Performs better than the Random Agent, with a steeper initial slope that continues steadily.
* **Key Points:**
* At ~10² steps: ~3 levels solved.
* At ~10³ steps: ~10 levels solved.
* At ~10⁴ steps: ~17 levels solved.
* The line terminates at 10⁴ steps. The orange shaded band is wider than the blue band, suggesting higher variance in performance.
3. **+ New-Action Prioritization (Green Line & Band):**
* **Trend:** Follows a very similar trajectory to the "+ Frame Segmentation" agent, often overlapping or running just above it.
* **Key Points:**
* At ~10² steps: ~3 levels solved.
* At ~10³ steps: ~10 levels solved.
* At ~10⁴ steps: ~18 levels solved (slightly above the orange line).
* The line terminates at 10⁴ steps. The green shaded band overlaps significantly with the orange band.
4. **Graph Exploration (Red Line & Band):**
* **Trend:** Demonstrates the strongest performance by a significant margin. It has the steepest slope throughout and continues to improve well beyond 10⁴ steps.
* **Key Points:**
* At ~10² steps: ~5 levels solved.
* At ~10³ steps: ~14 levels solved.
* At ~10⁴ steps: ~21 levels solved.
* At ~10⁵ steps: ~30 levels solved (the maximum on the y-axis).
* The red shaded band is the widest, especially at higher step counts, indicating the greatest variance in outcomes for this method.
### Key Observations
* **Clear Performance Hierarchy:** There is a distinct and consistent ordering of performance: Graph Exploration > + New-Action Prioritization ≈ + Frame Segmentation > Random Agent.
* **Logarithmic Progress:** All agents show progress that appears roughly linear on this semi-log plot, suggesting that the number of levels solved increases proportionally to the *logarithm* of the number of steps taken.
* **Divergence at Scale:** The performance gap between the Graph Exploration agent and the others widens dramatically as the number of steps increases (moving right on the x-axis).
* **Plateau vs. Continued Growth:** The Random Agent, + Frame Segmentation, and + New-Action Prioritization agents all appear to plateau or end their evaluation at 10⁴ steps. The Graph Exploration agent is the only one shown continuing to 10⁵ steps, where it achieves a much higher score.
* **Variance:** The width of the shaded bands suggests that the Graph Exploration method, while highest performing, also has the most variable results. The Random Agent has the most consistent (though lowest) performance.
### Interpretation
This chart likely comes from a research paper or technical report in reinforcement learning or AI agent design, specifically for a task involving sequential problem-solving (e.g., navigating a video game or solving puzzles). The data demonstrates the effectiveness of increasingly sophisticated exploration strategies.
* **The "Random Agent"** serves as a baseline, showing that naive, unguided exploration yields slow progress.
* **"+ Frame Segmentation" and "+ New-Action Prioritization"** represent incremental improvements. They likely incorporate mechanisms to better perceive the environment or prioritize useful actions, leading to roughly double the performance of the random baseline at 10⁴ steps.
* **"Graph Exploration"** represents a more advanced paradigm. The name suggests it builds an internal model or graph of the environment's state space, allowing for more efficient, directed exploration. Its superior and sustained performance indicates that this structured approach is far more sample-efficient, solving more levels with the same number of steps and continuing to learn effectively over a longer timeframe.
* **The widening gap** implies that for complex, long-horizon tasks, the choice of exploration strategy becomes critically important. Simple heuristics provide limited gains, while a robust model-based approach like graph exploration unlocks significantly higher capability. The increased variance might be a trade-off for this higher potential, or it could reflect the inherent difficulty and stochasticity of the later levels being solved.