## Bar Chart: MetaQA 2-Hop Hit@1 Scores
### Overview
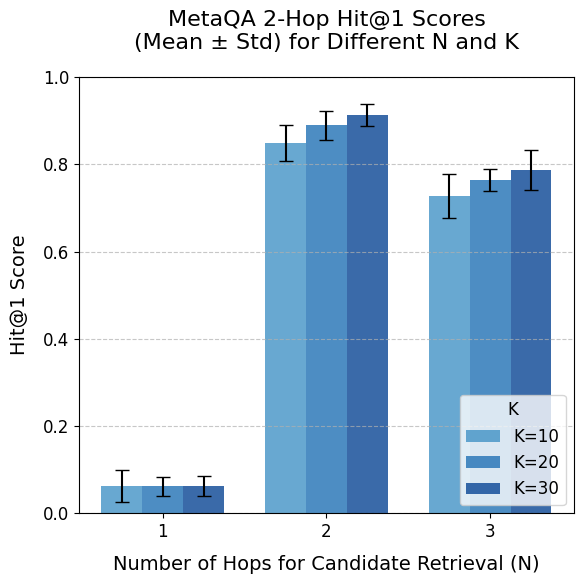
The image is a bar chart comparing MetaQA 2-Hop Hit@1 scores for different numbers of hops (N) and values of K. The chart displays the mean Hit@1 score with error bars representing the standard deviation. The x-axis represents the number of hops for candidate retrieval (N), with values 1, 2, and 3. The y-axis represents the Hit@1 score, ranging from 0.0 to 1.0. The chart includes a legend indicating the values of K: 10, 20, and 30, represented by different shades of blue.
### Components/Axes
* **Title:** MetaQA 2-Hop Hit@1 Scores (Mean ± Std) for Different N and K
* **X-axis:** Number of Hops for Candidate Retrieval (N)
* Values: 1, 2, 3
* **Y-axis:** Hit@1 Score
* Scale: 0.0 to 1.0, with increments of 0.2
* **Legend:** Located in the bottom-right corner.
* K=10 (light blue)
* K=20 (medium blue)
* K=30 (dark blue)
### Detailed Analysis
The chart presents Hit@1 scores for different combinations of N (number of hops) and K values. Each N value (1, 2, 3) has three bars representing K=10, K=20, and K=30. Error bars indicate the standard deviation for each bar.
* **N=1:**
* K=10 (light blue): Hit@1 score is approximately 0.06, with a standard deviation of approximately +/- 0.04.
* K=20 (medium blue): Hit@1 score is approximately 0.06, with a standard deviation of approximately +/- 0.03.
* K=30 (dark blue): Hit@1 score is approximately 0.06, with a standard deviation of approximately +/- 0.04.
* **N=2:**
* K=10 (light blue): Hit@1 score is approximately 0.84, with a standard deviation of approximately +/- 0.05.
* K=20 (medium blue): Hit@1 score is approximately 0.89, with a standard deviation of approximately +/- 0.03.
* K=30 (dark blue): Hit@1 score is approximately 0.91, with a standard deviation of approximately +/- 0.04.
* **N=3:**
* K=10 (light blue): Hit@1 score is approximately 0.72, with a standard deviation of approximately +/- 0.05.
* K=20 (medium blue): Hit@1 score is approximately 0.76, with a standard deviation of approximately +/- 0.03.
* K=30 (dark blue): Hit@1 score is approximately 0.78, with a standard deviation of approximately +/- 0.06.
### Key Observations
* For N=1, the Hit@1 scores are very low (around 0.06) regardless of the K value.
* For N=2, the Hit@1 scores are significantly higher, around 0.84 to 0.91, depending on the K value.
* For N=3, the Hit@1 scores are lower than N=2, ranging from 0.72 to 0.78.
* Generally, increasing K from 10 to 30 results in a slight increase in the Hit@1 score for N=2 and N=3.
### Interpretation
The data suggests that using two hops (N=2) for candidate retrieval yields the best Hit@1 scores for the MetaQA dataset. Increasing the value of K (number of candidates) generally improves the Hit@1 score, but the effect is more pronounced when moving from N=1 to N=2. The performance decreases when using three hops (N=3), indicating that there might be diminishing returns or increased noise with more hops. The low Hit@1 scores for N=1 suggest that a single hop is insufficient for effective candidate retrieval in this context.