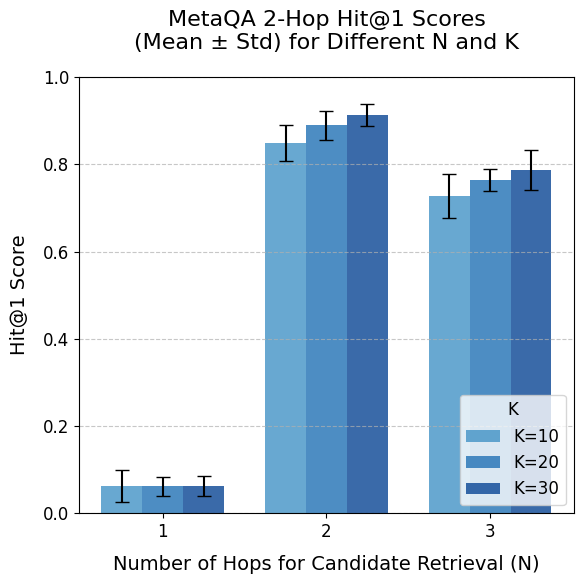
## Bar Chart: MetaQA 2-Hop Hit@1 Scores
### Overview
This bar chart displays the Mean ± Standard Deviation of Hit@1 scores for the MetaQA 2-Hop dataset, varying the number of hops (N) for candidate retrieval and the value of K (number of candidates). The chart uses bar groupings to compare the performance for different K values at each N value. Error bars are included to represent the standard deviation.
### Components/Axes
* **Title:** "MetaQA 2-Hop Hit@1 Scores (Mean ± Std) for Different N and K" - positioned at the top-center of the chart.
* **X-axis:** "Number of Hops for Candidate Retrieval (N)" - labeled with values 1, 2, and 3.
* **Y-axis:** "Hit@1 Score" - scaled from 0.0 to 1.0 with increments of 0.2. Horizontal gridlines are present at each 0.2 increment.
* **Legend:** Located in the bottom-right corner, identifying the K values:
* K=10 (Light Blue)
* K=20 (Medium Blue)
* K=30 (Dark Blue)
### Detailed Analysis
The chart consists of three groups of bars, one for each value of N (1, 2, and 3). Within each group, there are three bars representing the Hit@1 score for K=10, K=20, and K=30. Each bar is accompanied by an error bar indicating the standard deviation.
* **N=1:**
* K=10: The bar is approximately 0.12 tall, with an error bar extending from roughly 0.08 to 0.16.
* K=20: The bar is approximately 0.13 tall, with an error bar extending from roughly 0.09 to 0.17.
* K=30: The bar is approximately 0.14 tall, with an error bar extending from roughly 0.10 to 0.18.
* **N=2:**
* K=10: The bar is approximately 0.82 tall, with an error bar extending from roughly 0.76 to 0.88.
* K=20: The bar is approximately 0.90 tall, with an error bar extending from roughly 0.85 to 0.95.
* K=30: The bar is approximately 0.92 tall, with an error bar extending from roughly 0.87 to 0.97.
* **N=3:**
* K=10: The bar is approximately 0.73 tall, with an error bar extending from roughly 0.67 to 0.79.
* K=20: The bar is approximately 0.78 tall, with an error bar extending from roughly 0.72 to 0.84.
* K=30: The bar is approximately 0.80 tall, with an error bar extending from roughly 0.74 to 0.86.
### Key Observations
* The Hit@1 score increases significantly when the number of hops (N) increases from 1 to 2.
* The Hit@1 score decreases slightly when the number of hops (N) increases from 2 to 3.
* For each value of N, increasing K (from 10 to 30) generally leads to a higher Hit@1 score, although the difference is more pronounced at N=2.
* The error bars indicate that the standard deviation is relatively small, suggesting that the results are consistent.
### Interpretation
The data suggests that using two hops for candidate retrieval (N=2) yields the best performance in terms of Hit@1 score for the MetaQA 2-Hop dataset. Increasing the number of hops beyond two results in a slight decrease in performance. The positive correlation between K and Hit@1 score indicates that considering more candidates improves the chances of finding the correct answer, but the benefit diminishes as K increases. The relatively small standard deviations suggest that these trends are robust and not due to random chance. The chart demonstrates the importance of selecting an appropriate number of hops and candidate retrieval size for optimal performance in a multi-hop question answering system. The peak performance at N=2 could indicate that two hops are sufficient to retrieve the necessary information for answering the questions in this dataset, while additional hops introduce noise or irrelevant information.